
East Missoula, 2006
East Missoula’s story
East Missoula in pictures
Census counts: 1,707 in 1980, 2,465 in 2020. The archive holds 3 old photos and papers going back to 2006 and 3 maps from 1964 on.
Explore the history →Each edition grades its towns against each other only.
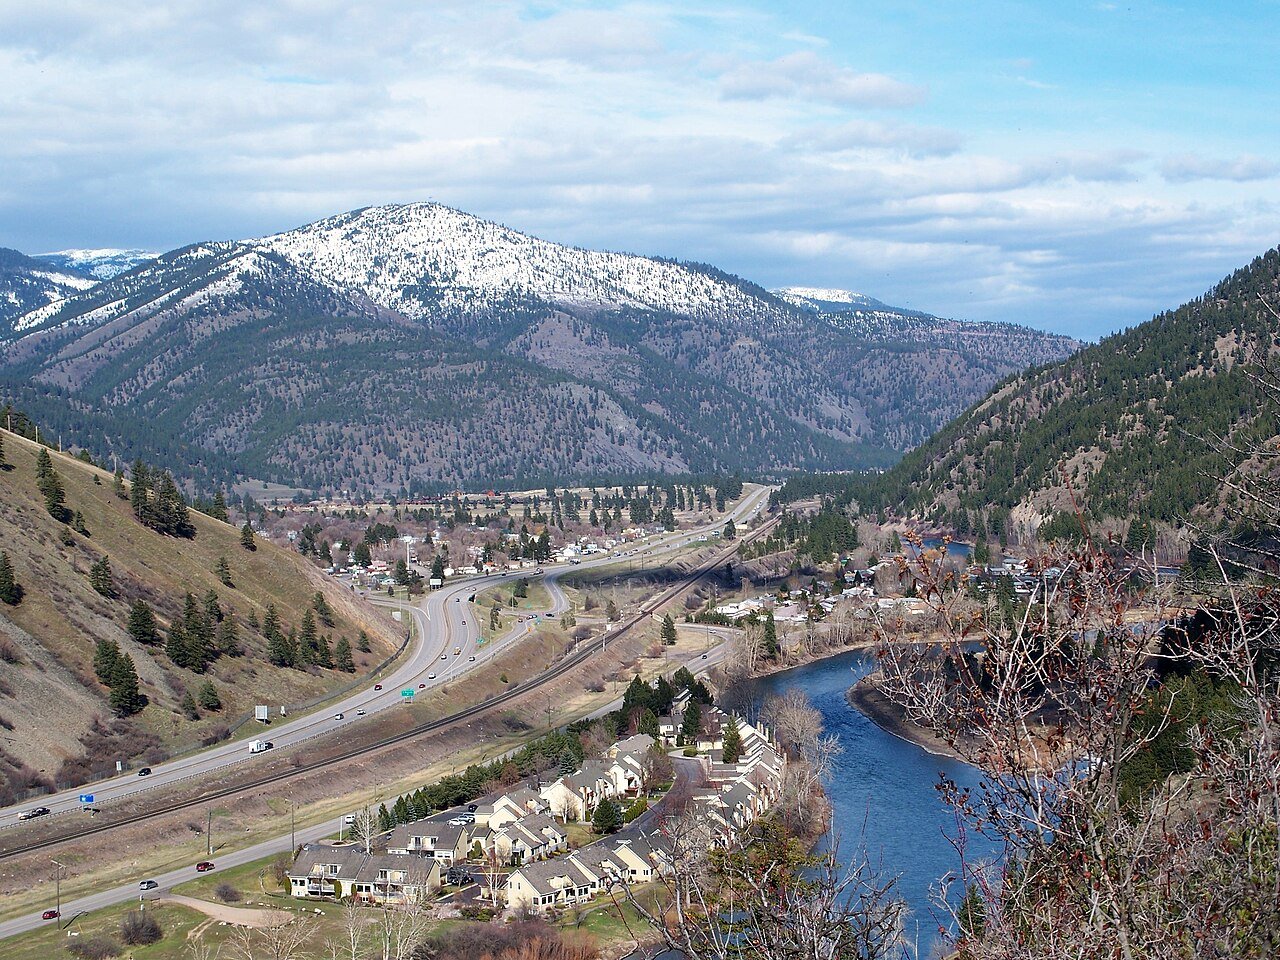
Population 2,099: a town in Montana.
The best of East Missoula’s subject grades is an A for walkability; the weakest is a C for cost of living. 3.6% of working residents work locally in East Missoula, against 39% in Montana’s towns and 8% across U.S. towns. Among 43 Montana towns, just 4 have a lower share of children under 18 than East Missoula. East Missoula's public schools beat 76% of Montana towns on state tests and graduation. East Missoula has fewer than 2,500 residents, so it gets subject grades but no overall grade.
Where East Missoula beats most towns.
2,157 counted in 2010 and 2,465 in 2020.
U.S. Census 2010 & 2020 counts
Each subject compared with towns across the country (schools within Montana), ordered by how far East Missoula is from typical.
How TownRatings grades towns →
Census counts: 1,707 in 1980, 2,465 in 2020. The archive holds 3 old photos and papers going back to 2006 and 3 maps from 1964 on.
Explore the history →East Missoula is unincorporated, so Missoula County and regional agencies provide most services.
EPA SDWIS (Oct 9, 2026) · HIFLD + EIA-861 2025 · Census 2020 ZCTAs · NCES 2024–25 · registration: vote.gov, updated Nov 18, 2024.
Ordered by what stands out in East Missoula.
The top destinations are Missoula (69%), Helena (2%) and Bozeman (2%). For most workers, East Missoula is a place to come home to: only 4% work in town. This Montana town had 260 jobs in 2023, up 158 from 2013. The typical journey to work here is 23 minutes.
| East Missoula | Montana towns | U.S. towns | |
|---|---|---|---|
| Average trip to work | 23 minutes | 17 minutes | 25 minutes |
| Median household income | $58,000 | $67,000 | $80,000 |
| Below the poverty line | 7.3% | 10% | 9.6% |
Census LEHD 2023 · ACS
The share of adults in East Missoula who have been diagnosed with depression: 28%. CDC measures, 32 in all: East Missoula beats Montana on 4 and trails on 2.
| East Missoula | Montana towns | U.S. towns | |
|---|---|---|---|
| Binge drink (CDC PLACES) | 23% | 20% | 16% |
| Yearly checkup (CDC PLACES) | 70% | 72% | 79% |
| High blood pressure (CDC PLACES) | 28% | 32% | 35% |
| Depression (CDC PLACES) | 28% | 25% | 23% |
| What stands out | East Missoula | MT |
|---|---|---|
| Fewer adults who have had cancer | 7.7% | 9.3% |
| Fewer adults with arthritis | 23.7% | 28.4% |
| Fewer adults treating high blood pressure | 70.1% | 73.4% |
CDC PLACES 2025 · modeled estimates for adults · CMS · HRSA
A winter brings about 43 inches of snow, with January nights at 17° and July afternoons at 84°.
NOAA U.S. Climate Normals, 1991–2020
Children under 18 are 14% of residents (21% statewide); adults 18 to 34 are 28% of residents (22% statewide). Montana has just over a third of adults 25 and older with a bachelor’s degree or more; here it is 31%. For East Missoula, the midpoint age is 40.3 years.
| East Missoula | Montana towns | U.S. towns | |
|---|---|---|---|
| Bachelor’s degree or more, 25+ | 31% | 30% | 29% |
| Median age | 40.3 years | 38.9 years | 40.5 years |
Somewhere between 38% and 59% women
The Census survey reached too few of East Missoula’s residents to say more: its margin here is ±10.6 points. Across Montana, 49.3% of residents are women.
| East Missoula | MT | U.S. | |
|---|---|---|---|
| Under 10 | 5.8% | 11% | 11.6% |
| 10 to 17 | 8.4% | 10% | 10.3% |
| 18 to 24 | 7.8% | 9% | 9.1% |
| 25 to 34 | 20.2% | 12.9% | 13.7% |
| 35 to 44 | 17.8% | 12.9% | 13.2% |
| 45 to 54 | 9.4% | 11.1% | 12.2% |
| 55 to 64 | 12.7% | 13% | 12.7% |
| 65 to 74 | 7.3% | 12.4% | 10.2% |
| 75 and older | 10.7% | 7.8% | 7% |
| No diploma | 9.2% | 5.4% | 10.4% |
| High school | 23.8% | 27.5% | 26% |
| Some college | 24.5% | 22.4% | 19.1% |
| Associate’s | 11.3% | 9.6% | 8.8% |
| Bachelor’s | 24.8% | 23.2% | 21.6% |
| Graduate | 6.5% | 12% | 14.1% |
U.S. Census Bureau · ACS 2020-2024 5-year estimates · in a town of 2,100, single groups can be off by several points
In 2 parks and preserves, walkers have 0.7 miles of trail. The density of trails for East Missoula comes to 0.6 miles per square mile.
| East Missoula | Montana towns | U.S. towns | |
|---|---|---|---|
| Conserved land | 9.3% | 9.2% | 4.3% |
| Miles of trail per square mile | 0.6 miles per square mile | 0.6 | 0.4 |
| Biggest places to walk | Trails | Acres |
|---|---|---|
| 1. East Missoula Lions Park | 0.2 mi | 4 |
| 2. Canyon View County Park | — | 1 |
Trails & parks © OpenStreetMap contributors · Conserved land: USGS PAD-US
FEMA puts 72% of East Missoula’s expected hazard losses down to avalanches, and 13% to inland flooding. Expected storm and flood damage is higher than in 54% of U.S. communities.
FEMA National Risk Index · OpenFEMA
Among households in East Missoula, 68% are owner-occupiers. Its going rate for rent is $1,050 a month.
| East Missoula | Montana towns | U.S. towns | |
|---|---|---|---|
| Households that own their home | 68% | 64% | 73% |
| Median rent | $1,050 a month | $1,000 a month | $1,185 a month |
Census ACS, 2020–24 · Zillow Home Value Index · Redfin Data Center
Museums, parks, gardens and other places to visit around East Missoula. Close and well known come first.
 10 mi LakeLake Missoula10 mi Ski areaMontana Snowbowl64 runs · 2,538 ft vertical
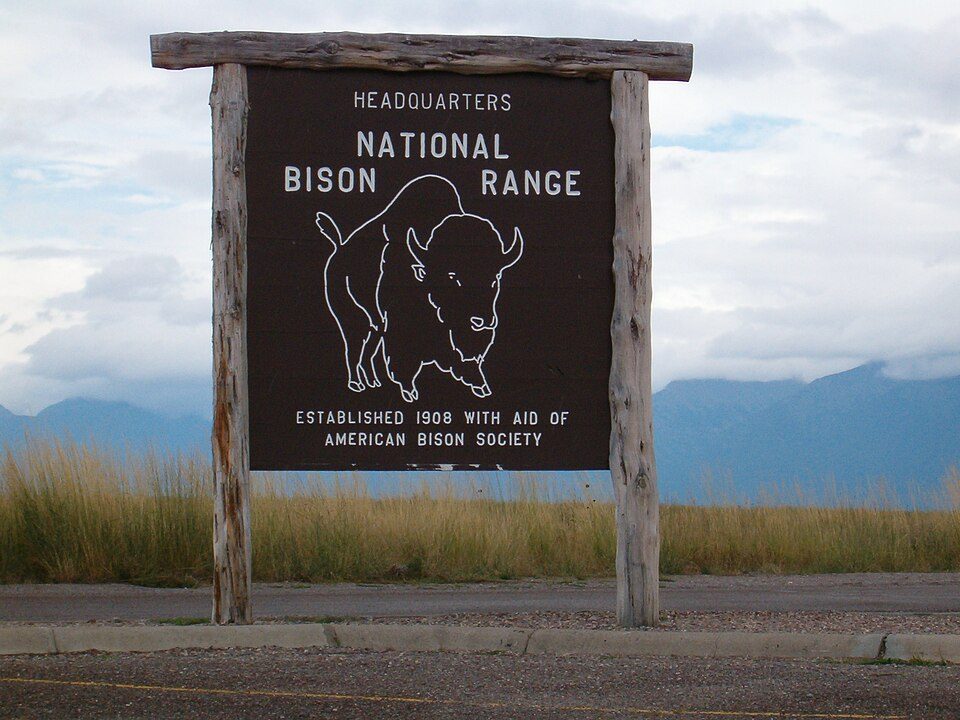 33 mi Park & preserveCSKT Bison Range
 2 mi TheatreWilma Theater
 2 mi MuseumMontana Museum of Art & Culture3 mi MuseumMissoula Art Museum
Lake Missoula: USGS, Public domain · CSKT Bison Range: Paul Frederickson, CC BY 2.5 · Wilma Theater: Publichall, CC BY-SA 3.0 · Montana Museum of Art & Culture: DocFreeman24, CC BY-SA 4.0
1 within 15 miles of the center of East Missoula
About 4 of every 100 East Missoula residents are enrolled in college, about the same as Montana.
Where East Missoula’s working residents go each day. Line width shows the share.
Census LEHD 2023
Census-designated place in Montana, United States
East Missoula is an unincorporated community and census-designated place (CDP) in Missoula County, Montana, United States. It is part of the Missoula metropolitan area. The population was 2,465 at the 2020 census, up from 2,157 in 2010.
From Wikipedia, licensed CC BY-SA 4.0 · facts via Wikidata (CC0)
One town shares a border with East Missoula.
| Town | MT rank | Overall | Cost | Safety | Schools | Health |
|---|---|---|---|---|---|---|
| East Missoula | — | — | C | — | A− | B+ |
| Missoula | #21 | C+ | D | D | A− | A− |
East Missoula has fewer than 2,500 residents, so it gets subject grades but no overall grade. East Missoula reports no FBI crime data of its own. Compare East Missoula with a neighbor →
Short answers, built from the data on this page.
The typical home is worth about $359,000, 23% below the Montana typical home. Cost of living, which also weighs rents, property taxes and how many households pay 30% or more of their income for housing, grades C.


