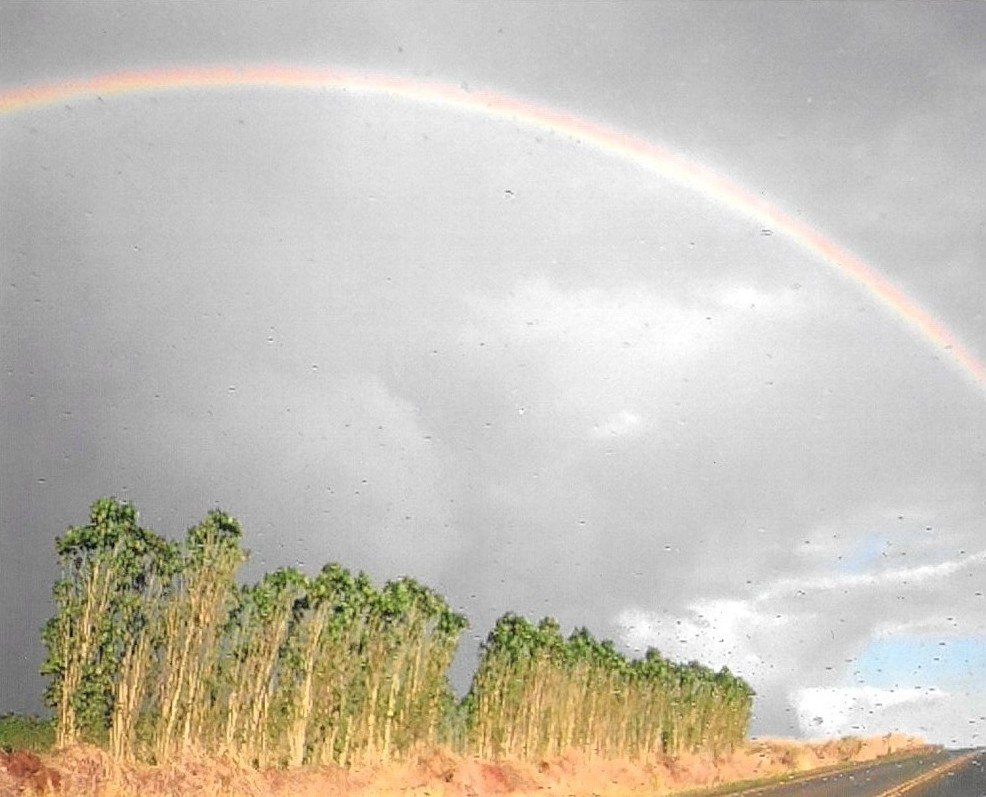
 Photo: The Eloquent Peasant · CC BY 4.0
FEMA puts Wahiawa’s expected hazard damage per building above that of 85% of U.S. towns, mostly from river and rain flooding
On FEMA’s National Risk Index, Wahiawa gets a C− for hazard risk: higher expected damage per building than 85% of U.S. towns, #13 of 93 in Hawaii. Most of that expected damage is river and rain flooding (82%), then earthquakes (13%). FEMA’s files show no paid flood insurance claims here.
Graded on FEMA’s expected yearly building damage per dollar of building value (NRI v1.20, December 2025), weighted by where residents live; flood claims are shown, not graded. How hazard risk is graded
What Wahiawa faces
Each hazard’s share of the building damage FEMA expects here, and how its rate compares with the rest of the country.
River and rain flooding
Earthquakes
Wildfire
Shares are of FEMA’s expected building damage, the measure the grade uses; ranks compare each hazard’s building-damage rate with all 85,154 U.S. census tracts. In FEMA’s terms, river and rain flooding is FEMA’s “Inland Flooding” (rivers and streams overflowing their banks, or rain overwhelming drainage). FEMA defines coastal flooding as high or rising tides and storm surge, so surge damage is counted there. Drought isn’t listed: FEMA counts its losses in crops only.
What’s behind Wahiawa’s grade
River and rain flooding is 82% of the building damage FEMA expects in Wahiawa, and Wahiawa’s rate of river and rain flooding damage is in the top 10% of U.S. census tracts. Wildfire adds 5%, at a rate in the top 5% of U.S. census tracts.
C− #13 of 93 in Hawaii; higher expected damage per building than 85% of U.S. towns (21,298).
Wahiawa’s residents live in 7 census tracts; FEMA’s figures are combined by where they live.
The typical Hawaii town has higher expected damage than 96% of U.S. towns; within the state, Wahiawa has less expected damage per building than 87% of Hawaii towns.
In dollars, FEMA expects about $5.5M a year in losses across Wahiawa: $4.8M to buildings, the rest to people and crops.
Does Wahiawa flood? No paid flood claims on record
FEMA’s records show no paid flood insurance claims in Wahiawa. That’s not a promise: most homes don’t carry flood insurance, so small floods go unrecorded.
Wahiawa isn’t in FEMA’s Community Rating System, which cuts flood insurance up to 45% in towns that do extra flood-proofing.
Insurance rates: Honolulu County.2 federal disasters brought FEMA money to Wahiawa
Disasters that paid out in Wahiawa itself (aid to households or repair grants to Wahiawa), newest first, with that year’s flood claims.
- 2026Severe Storms, Flooding, Landslides, and Mudslides48 households applied for aid$192K aid approved
- 2008Severe Storms and Flooding55 households applied for aid$157K aid approved
Honolulu County has had 19 natural disasters declared by the President since 1953, most often severe storms, then hurricanes and tropical storms.
Also 4 FEMA wildfire suppression grants (Fire Management Assistance, not a disaster declaration) for fires in Honolulu County, 2005–2025.
Old photos of Wahiawa after a storm or flood belong in the town’s history. Add one, or share what you remember below.
Add to the Wahiawa archive →Wahiawa and its neighbors
Wahiawa has the lowest expected damage per building of the 4 graded towns here. Tap a town to see its hazards.
| Town | Hazard risk | Mostly (buildings) | Flood claims |
|---|---|---|---|
| Wahiawa | C−more damage than 85% | river and rain flooding | 0 |
| Wheeler AFB | Dmore damage than 90% | river and rain flooding | — |
| Schofield Barracks | Dmore damage than 91% | river and rain flooding | — |
| Whitmore Village | Dmore damage than 92% | river and rain flooding | — |
Hazard risk = FEMA’s expected yearly building damage per dollar of building value, vs. the 21,298 U.S. towns we grade; the map is shaded by fifths of the same scale. Flood claims = paid federal flood insurance claims on record.
Get ready for what Wahiawa faces
A short kit for the hazards that drive the building damage here, what to check before you buy, and where neighbors get alerts.
- Turn around at flooded roads: a foot of moving water can carry off a car.
- Flood insurance usually takes 30 days to start, so buy it before the forecast.
- Keep papers and medicines up high, in a grab-and-go bag.
- Drop, cover and hold on.
- Strap tall furniture and the water heater to the wall.
- Know how to shut off the gas.
- Clear dead leaves and brush within 5 feet of the house.
- Sign up for local alerts and know two ways out.
- Keep N95 masks for smoky days.
- Look up the address on FEMA’s flood map.
- Ask the seller or landlord whether it has ever flooded, and what flood insurance costs there.
- Get a flood insurance quote early: policies usually start 30 days after you buy.
Know where neighbors sign up for alerts? Add it to the Handbook so everyone has it.
Questions about natural hazards in Wahiawa
Is Wahiawa at risk for natural disasters?
On FEMA’s National Risk Index, Wahiawa has higher expected damage per building than 85% of U.S. towns: C− for hazard risk, #13 of 93 in Hawaii. Most of the expected damage is river and rain flooding (82%) and earthquakes (13%). This is FEMA’s model of an average year for today’s buildings, not a forecast.
Is Wahiawa in a flood zone?
Flood zones are drawn street by street, so the answer depends on the address: look it up on FEMA’s flood map. In Honolulu County, 54% of homes in mapped flood zones carry federal flood insurance, and 4.1% of all homes do.
How much is flood insurance in Wahiawa?
FEMA’s Community Rating System list shows no discount for Wahiawa’s flood program. Premiums depend on the building; policies usually start 30 days after you buy, so get a quote early.
What was the biggest storm in Wahiawa?
By FEMA money that reached Wahiawa, Severe Storms, Flooding, Landslides, and Mudslides (2026): 48 households applied for aid, $192K approved.
Is Wahiawa at risk from river and rain flooding?
It is the largest share of the building damage FEMA expects here (82%), and Wahiawa’s rate for it is in the top 10% of U.S. census tracts.
Storm stories
Memories, warnings and help from neighbors in Wahiawa.
Sources: FEMA National Risk Index v1.20 (December 2025), census-tract table, combined by where Wahiawa’s residents lived in the 2020 census; OpenFEMA: NFIP redacted claims, multiple-loss properties, community status book and residential penetration rates, housing assistance (owners and renters), public assistance funded projects, hazard mitigation properties and disaster declarations. Homes: Census ACS 2020–24. Preparedness tips: Ready.gov. FEMA’s model is an average of expected damage, not a forecast. How hazard risk is graded.