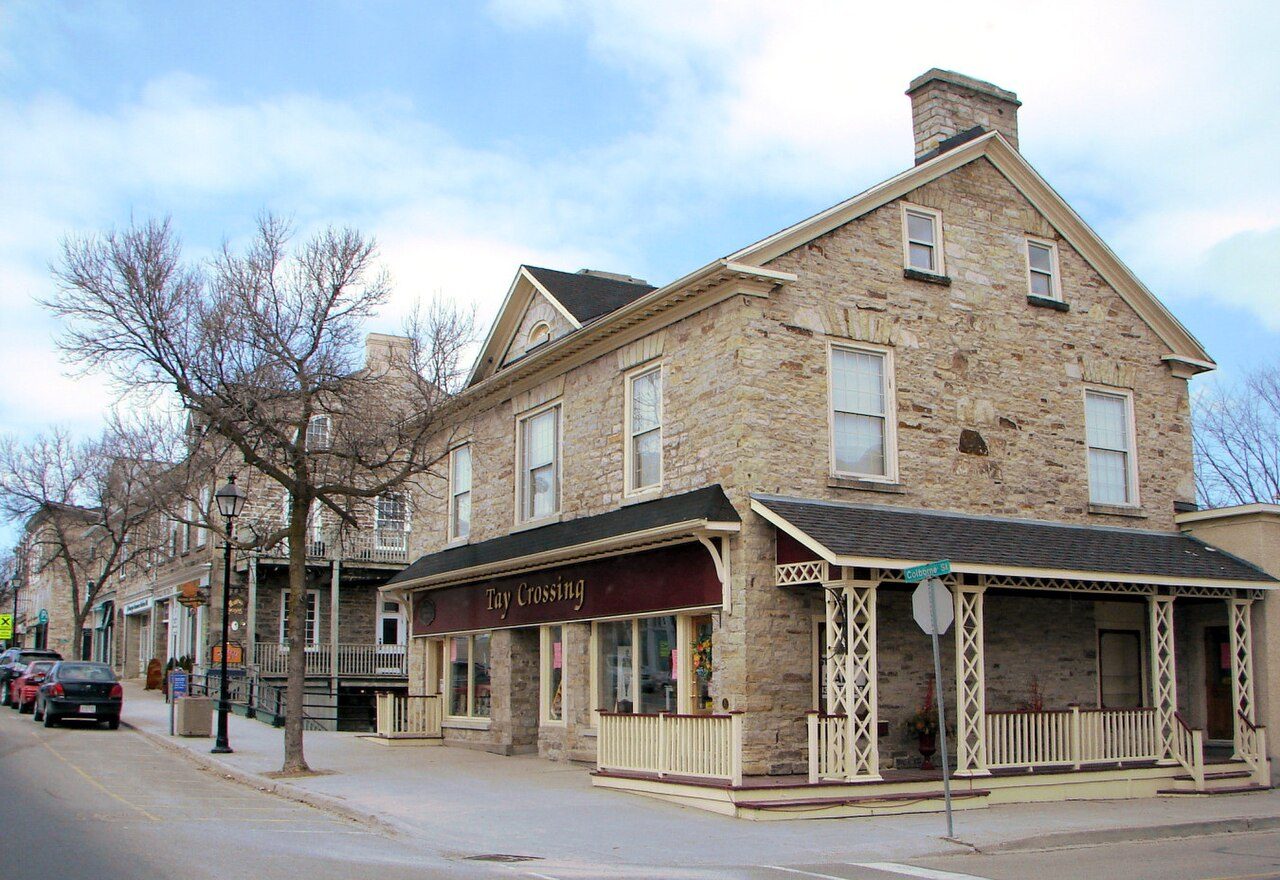
 Photo: P199 · CC BY-SA 3.0
Summer afternoons in Perth are warmer than in 88% of Canadian towns
January nights here settle around −14.2°C. Counting rain and snow together, it is wetter than 62% of Canadian towns. From frozen January to warm July, readings climb 41°C. For walks and days out, June, August and September bring highs of 21–26°C.
ECCC publishes no normals for Perth itself; the figures are those of Drummond Centre, 14 km north.
A year in Perth at a glance
Each month’s typical high and low, in °C.
What stands out about Perth’s climate
Compared with Canadian towns, with its place among towns of 2,500+ in Ontario beside it.
What a year in Perth feels like
Each season’s and each month’s usual high and low, 1991–2020.
Frost on 163 days, 20°C on 121
The frost season runs September to May, and January freezes nearly every night. Deep cold, under −20°C, comes on about 19 nights a year.
Frost days by month
Average days at 0°C or below
Days above 20°C by month
Average days
About 939 mm of rain and snow a year
September is the wettest month and February the driest. Some 123 days a year see 1 mm of rain or snow or more.
Rain and snow by month
Millimetres
Rain alone by month
Millimetres
Snowfall: about 187 cm in a normal year
Snow falls from October to April, most of all in January (about 46 cm).
Snowfall by month
Centimetres
Snow on the ground by month
Centimetres at month’s end
Heating a home in Perth
92% of a year’s heating need falls between October and April. Months averaging under 10°C: October to April.
Measured against 18°C: each day’s shortfall in mean temperature, added over twelve months.
Living with Perth’s climate
The averages read for the garden, the outdoors and the coldest and hottest days.
The comfortable months for a day outside, highs of 17–27°C and nights of 8°C or more: Jun, Aug and Sep.
Parks & trails →Thirty years of averages say little about one bad storm; Perth’s hazards page does.
Flood & hazards →ECCC’s normals location: Drummond Centre
Drummond Centre is one of the 450 places where ECCC publishes 1991–2020 normals.
| Distance from the town | 14 km north |
| Station altitude | 145 m |
| Completeness | meets the WMO “3 and 5” rule |
| WMO standard normals | No |
| Coldest reading, 1991–2020 | −36.0°C |
| Hottest reading, 1991–2020 | 37.0°C |
| Next-nearest location | Brockville, 49 km |
How Perth compares
Against the 2,611 Canadian towns and neighbourhoods of 2,500 or more, each read from its own normals location; the dots are the other locations those towns use in Ontario.
Nearby towns’ climate
The nearest places on a normals location of their own: those that share Perth’s would only repeat its figures. No closer places have figures: these lie 24–45 km from Perth.
| Town | July high | January low | Rain & snow |
|---|---|---|---|
| Perth Drummond Centre | 27.1°C | −14.2°C | 939 mm |
| Rideau Lakes 24 km · Brockville | 26.1°C 1.0°C cooler | −11.3°C 2.9°C milder | 1,017 mm |
| Merrickville 31 km · Kemptville | 26.8°C about the same | −14.0°C about the same | 925 mm |
| Central Frontenac 41 km · Centreville | 27.2°C about the same | −12.4°C 1.8°C milder | 984 mm |
Perth weather by month
Month by month, 1991–2020: the usual high, low and mean, the rain and snow, and the snowfall.
| Month | High | Low | Mean | Rain & snow | Snow |
|---|---|---|---|---|---|
| January | −4.6°C | −14.2°C | −9.5°C | 74 mm | 46 cm |
| February | −2.3°C | −13.5°C | −8.0°C | 57 mm | 40 cm |
| March | 3.7°C | −7.3°C | −1.9°C | 62 mm | 27 cm |
| April | 11.6°C | 0.1°C | 5.9°C | 78 mm | 11 cm |
| May | 19.8°C | 6.8°C | 13.2°C | 74 mm | under 1 cm |
| June | 24.4°C | 11.9°C | 18.1°C | 89 mm | 0 cm |
| July | 27.1°C | 14.3°C | 20.7°C | 89 mm | 0 cm |
| August | 25.8°C | 13.2°C | 19.5°C | 88 mm | 0 cm |
| September | 21.2°C | 9.1°C | 15.2°C | 91 mm | 0 cm |
| October | 13.3°C | 3.5°C | 8.4°C | 87 mm | 2 cm |
| November | 5.9°C | −2.4°C | 1.8°C | 75 mm | 17 cm |
| December | −1.2°C | −9.0°C | −5.1°C | 74 mm | 43 cm |
| Year | 12.1°C | 1.0°C | 6.5°C | 939 mm | 187 cm |
In March, anything from −33.0°C to 27.0°C
January is the least predictable month: about two years in three its average lands within 3.0°C of the normal, −9.5°C. June is the steadiest, within 1.1°C.
Where Perth’s numbers come from
Averages over 30 years, not a forecast.
- Normals: 1991–2020 normals for Drummond Centre from ECCC’s climate data site, the nearest location with every month of temperature.
- Comparisons: Canada’s towns and neighbourhoods of 2,500+ (no city totals, no reserves), each through its own nearest location.
- Not on this page: hours of sunshine, missing from the 1991–2020 normals, and a height correction: the town has no elevation on file.
Canadian Climate Normals 1991–2020 · ECCC Data Services End-use Licence. Data Source: Environment and Climate Change Canada
Questions about Perth’s climate
How warm does Perth get in summer?
July is the warmest month, with average highs of 27.1°C.
How cold does Perth get in winter?
Midwinter means January, when a typical night reaches −14.2°C.
How much rain and snow does Perth get?
A normal year brings 939 mm, snow included as water: September is wettest at 91 mm, February driest at 57 mm.
How long does snow stay on the ground?
About 116 days a year have 1 cm of snow or more on the ground.
Are these figures for Perth itself?
They are the closest available: the normals for Drummond Centre, since Perth has none.
Data Source: Environment and Climate Change Canada · ECCC Data Services End-use Licence Today’s forecast for Perth →
Adapted from Statistics Canada (Census of Population 2021, population estimates 2025, 2021 census boundaries) under the Statistics Canada Open Licence; this does not constitute an endorsement by Statistics Canada. Neighbourhood names in some cities © OpenStreetMap contributors (ODbL).