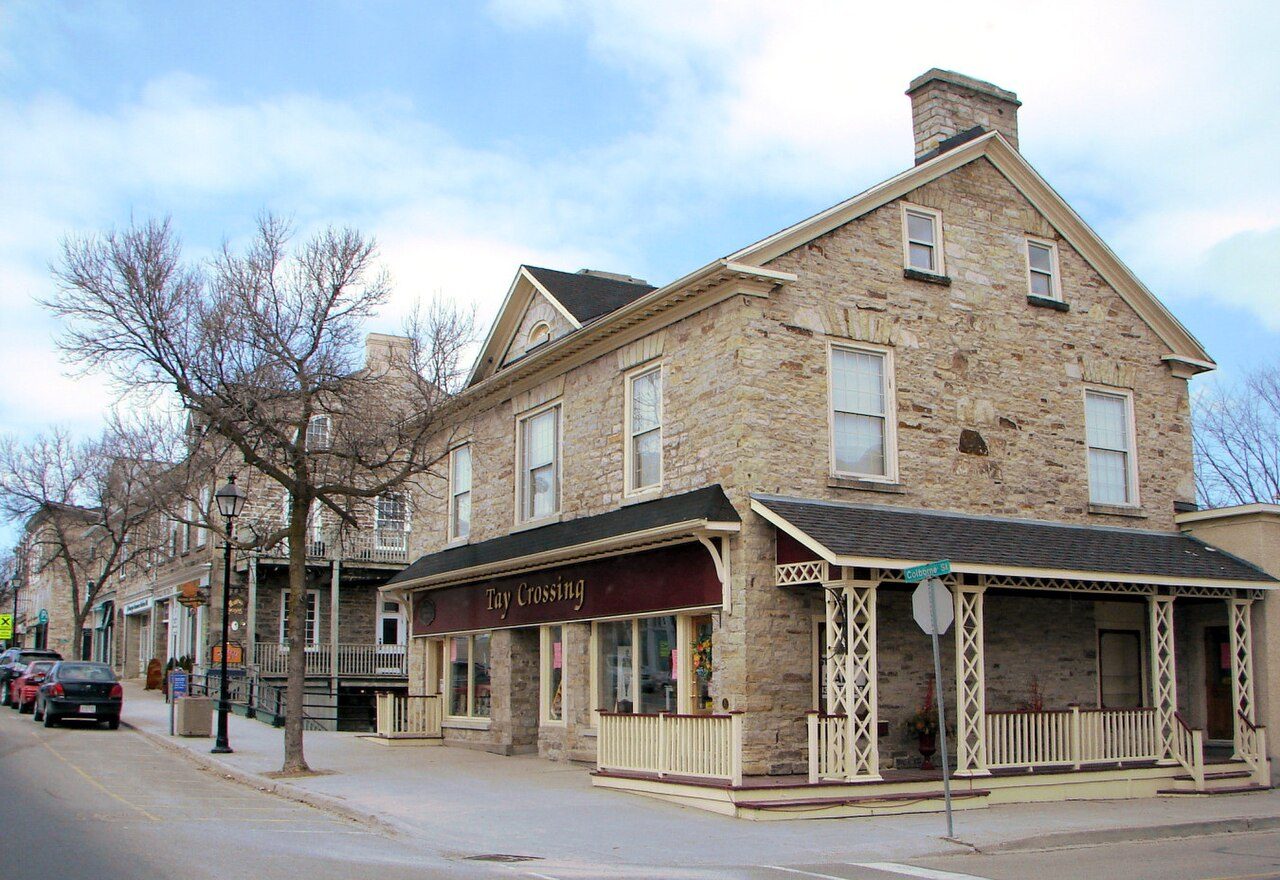
PerthOntario
In Ontario, this town has 6,972 residents. Its census division is Lanark.
Is Perth a good place to live?
A town with more to fix than most. Buying in is costly (D). Perth grades C− overall and ranks #792 of 858 in Ontario. It comes out better than 16% of Canadian towns. The local economy is weaker than most (C−). Its strongest subject is walkability (A+). Hazard risk is weaker too (D). Its other grades sit near the middle: C+ for schools and B for health.
This town's rent is the 2021 census rent scaled to 2025 by its province's ratio of surveyed to census rents: no rental survey covers it, so its Cost Grade is less sure. Health is graded on the health region's survey figures and life expectancy, with the distance to hospital giving the town its own spread.
How Perth grades
Each subject compares Perth with Canadian towns of 2,500 or more, ordered by how far it is from the middle. Towns in other countries are graded separately.
How TownRatings grades Canadian towns →
What makes Perth stand out
The 3 things Perth does most differently from other towns.
The data
Data highlights are ordered by what stands out in Perth.
Measured against local pay, Perth costs more to live in than nine in ten Canadian towns
Owners put the median home at $400,000, about level with Canadian towns ($406,000) and below Ontario’s towns ($695,000). A year’s rent came to 25% of the median household income, above both Ontario’s towns (22%) and Canadian towns (20%).
What homes were worth · The median owner’s estimate at the 2021 census
| Census 2021 | Perth | Ontario | Canada |
|---|---|---|---|
| Rent as a share of income | 25% | 22% | 20% |
| Median home value, 2021 | $400,000 | $695,000 | $406,000 |
| Households spending 30%+ on shelter | 23% | 22% | 18% |
Statistics Canada, Census 2021; CMHC Rental Market Survey via Statistics Canada · These are 2021 census values, as owners judged them, set against household income in 2020.
Perth faces more hazards than nine in ten Canadian towns
Rideau Valley Conservation Authority has mapped the flood hazard here, one of 2 studies on the national inventory. More homes than usual carry radon here, 19% over the guideline where the typical town has 6.6%. Shaking is a bigger worry than in most places, at $0.081 a year per $1,000 of building value ($0.030 typical).
Radon tests above the guideline · share of tested homes, 200 Bq/m³
| Hazards | Perth | Ontario | Canada |
|---|---|---|---|
| Radon tests above the guideline | 19% | 4% | 6.6% |
| Earthquake loss per $1,000 of buildings a year | $0.081 | $0.043 | $0.030 |
NRCan seismic risk model and burned areas, Health Canada radon survey, the Flood Hazard Map Inventory
Driving to work is less common in Perth than in Ontario’s towns or Canadian towns: 83% of commuters
Workers spend 24 min getting to work, on average.
How working residents got to work · census 2021
| Census 2021 | Perth | Ontario | Canada |
|---|---|---|---|
| Average trip | 24 min | 29 min | 26 min |
| Car or van | 83% | 88% | 89% |
Statistics Canada, Census 2021 (labour and commuting) · These are May 2021 figures, gathered while COVID-19 kept many people home or out of work.
Visible minorities make up less of Perth than of Ontario’s towns or Canadian towns: 2.5%
4.2% of residents have an Indigenous identity, above Ontario’s towns (1.6%) and Canadian towns (2.8%) alike. Immigrants make up 6.6% of residents, about level with Canadian towns (6.4%) and below Ontario’s towns (7.6%).
Ages · Share of residents in each age group, Census 2021
Schooling · Highest qualification, residents 15 and over
Women and men · all residents
Women make up 55.4% of Perth
Census 2021 put women at 3,585 and men at 2,885; women are 50.9% of Canada.
| Perth | Ontario | Canada | |
|---|---|---|---|
| Under 15 | 11% | 15% | 16% |
| 15 to 64 | 50% | 65% | 64% |
| 65+ | 39% | 19% | 19% |
| No certificate, diploma or degree | 16% | 15% | 16% |
| Postsecondary qualification | 54% | 56% | 56% |
Statistics Canada, Census 2021; Ontario and Canada: medians of towns of 2,500+
January nights in Perth drop to −14.2°C (Ontario towns −9.1°C, Canadian towns −13.5°C)
Frosty days number 163 in a normal year, higher than Ontario’s towns (139) and near Canadian towns (159). Expect July highs of around 27.1°C in Perth. Snow peaks in January: 46 cm in a normal year. A normal September brings 91 mm of precipitation, more than any other month.
Average high by season · ECCC normals, 1991–2020
| Normals, 1991–2020 | Perth | Ontario | Canada |
|---|---|---|---|
| Snowfall a year | 187 cm | 146 cm | 141 cm |
| July afternoon high | 27.1°C | 26.7°C | 25.5°C |
| January night low | −14.2°C | −9.1°C | −13.5°C |
| Days with frost a year | 163 | 139 | 159 |
Environment and Climate Change Canada, Canadian Climate Normals 1991–2020 (Drummond Centre)
Violent crime weighs more on Perth than on Ontario’s towns or Canadian towns: a violent severity index of 120
Police recorded 17.2 violent incidents per 1,000 residents a year, above Ontario’s towns (10.5) and Canadian towns (12) alike. Property crime accounts for 26.8 incidents per 1,000 residents a year.
Year by year · Crime Severity Index for each year
| 2023–2025 | Perth | Ontario | Canada |
|---|---|---|---|
| Violent Crime Severity Index | 120 | 76 | 86 |
| Violent crime | 17.2 | 10.5 | 12 |
| Property crime per 1,000 | 26.8 | 30.5 | 31.2 |
Statistics Canada, Uniform Crime Reporting Survey, 2023–2025 average
Very good or excellent health for 51% of adults in Perth’s health region
Measured across the Leeds, Grenville and Lanark District Health Unit: health survey and life expectancy
Smoking is commoner than in the province: 14% of adults, against 11% for Ontario. The region’s 2022/2024 life expectancy is 81.2, with women at 83.3 and men at 79.2. Arthritis, diabetes and high blood pressure affect 18% of the region’s adults on average, near both Ontario’s towns (17%) and Canadian towns (17%). The town’s own part is the trip to care, and Perth is well placed: 1.0 km to a hospital on average, against 3.7 km typical.
Very good or excellent health · adults, age-standardised
| Health | Perth | Ontario | Canada |
|---|---|---|---|
| Smokers | 14% | 10% | 12% |
| Life expectancy at birth | 81.2 | 82.8 | 81.5 |
| Chronic conditions (average share) | 18% | 17% | 17% |
Statistics Canada, Canadian Community Health Survey 2023/2024 and life expectancy 2022/2024; Open Database of Healthcare Facilities
4 of Perth’s 6 tested schools score in the lower two fifths in Ontario
No French-language school is among them; in Ontario, 10% of schools are. Taken together, Perth and its 3 km edge hold 6 elementary schools and 2 secondary schools for 2,440 students.
| School | Level | Students | System |
|---|---|---|---|
| St John Elementary School CatholicLargest elementary schoolElementary · Grades JK–6 | Elementary · Grades JK–6 | 375 | English Catholic |
| Perth and District Collegiate Institute Bottom fifth in OntarioLargest secondary schoolSecondary · Grades 9–12 | Secondary · Grades 9–12 | 580 | English public |
Schools by system · Schools within 3 km
| Schools within 3 km | Perth | Ontario | Canada |
|---|---|---|---|
| School boards | 2 | 4 | 3 |
Provincial school lists and results, 2024-25
Expect November days around 6°C in Perth, nights around −2°C
Into December, the normals move to −1°C and −9°C. About 17 cm of snow falls in a normal November. In November, the normal is 75 mm of rain and snow. Hour-by-hour figures come from ECCC’s Smiths Falls forecast, on the Weather page.
Normal highs, the months ahead · ECCC normals, 1991–2020
| Season | High | Low | Rain and snow |
|---|---|---|---|
| Winter | −3°C | −12°C | 204 mm |
| Spring | 12°C | 0°C | 214 mm |
| Summer | 26°C | 13°C | 267 mm |
| Autumn | 13°C | 3°C | 253 mm |
ECCC normals, 1991–2020 (Drummond Centre); the forecast is on the Weather page
Fewer than nine in ten Ontario’s lower-tier municipalities spend as much per resident as Perth
The October 2022 vote made Judy Brown mayor of Perth, heading 7 seats.
| Turnout | Perth | Ontario | Canada |
|---|---|---|---|
| Municipal election, 2022 | 46% | 31% | 31% |
Wikidata, MAMH, MMAH, Statistics Canada
Perth’s public library is Perth & District Union Public Library
The library is 0.4 km from the centre of Perth.
Provincial library statistics, OpenStreetMap, the CRA and Statistics Canada
Thousand Islands National Park is 32 km from Perth
Count 10 protected areas within 10 km of town. The nearest provincial park, Murphys Point Provincial Park, is 9.4 km away. Within 10 km of the town, 5.4% of the land is protected, against 2.3% around a typical Canadian town. One named trail is close: the Rideau Trail - Central Section.
Protected land · of the land within 10 km
| Outdoors | Perth | Ontario | Canada |
|---|---|---|---|
| Protected land within 10 km | 5.4% | 2.3% | 2.3% |
| Public protected areas within 10 km | 2 | 4 | 4 |
Canadian Protected and Conserved Areas Database (CPCAD), OpenStreetMap routes and beaches
Before 1961: 41% of the homes in Perth
Go back to 1830 and you reach McMartin House, the oldest of them. Inside the town there are 3 historic places, all of them top designations.
Historic places by designation · inside the town
Among them
- McMartin House 1830
- Matheson House 1840
- Perth Town Hall 1863
| Heritage | Perth | Ontario | Canada |
|---|---|---|---|
| Homes built before 1961 | 41% | 22% | 18% |
Canadian Register of Historic Places, Directory of Federal Heritage Designations, Québec’s Répertoire du patrimoine culturel, Wikidata; Census 2021 homes by period
Everything we know about Perth
Matheson House and 2 more in and around Perth
A first look at Perth’s museums, historic sites and days out, and a few just outside town.


Photos: each place’s Wikidata image, from Wikimedia Commons under the licence below (our copy, resized).
Photo credits (2)
- Matheson House: JustSomePics, CC BY-SA 3.0, Wikimedia Commons
- McMartin House: Kenn Chaplin from Toronto, Canada, CC BY-SA 2.0, Wikimedia Commons
Famous people from Perth
36 notable people were born in Perth.


Photo credits
Billy Smith: Horge, CC BY 3.0 · John Robson: User Digging.holes on fr.wikipedia, Public domain · Alexander Morris: William James Topley, Public domain · Jared Coreau: TheAHL, CC BY 2.0 · James Joseph McCann: Paul Horsdal, Public domain · John Graham Haggart: William James Topley, Public domain
About Perth
Town in Ontario
The boundary here is Statistics Canada’s: Perth is one census subdivision in Ontario, and TownRatings describes all of it.
Statistics Canada: population estimates 2025 (17-10-0155), Census of Population 2021, 2021 census boundaries.
- Population
- 6,972 (people, 2025 estimate)
- Province or territory
- Ontario
- Census division
- Lanark
- Census subdivision
- 3509021
Perth’s neighbours
The nearest places of 1,000 or more. Statistics Canada
| Town | People | km | Overall | Cost | Safety | Health |
|---|---|---|---|---|---|---|
| Perth | 6,972 | — | C− | D | C+ | B |
| Drummond/North Elmsley | 8,817 | 7 | C+ | C | A+ | B− |
| Tay Valley | 6,171 | 10 | C+ | C | A | B− |
| Smiths Falls | 11,093 | 19 | D− | D | C− | B |
People: Statistics Canada, Census 2021. Distances: centre to centre.
Questions about Perth
Has Perth grown?
Between the 2016 and 2021 censuses it went from 5,930 to 6,469 residents (up 9.1%; Canadian towns’ median: 4.1%), and Statistics Canada now estimates 6,972.
Who are the people of Perth?
3% of residents belong to a visible minority, against 15% for the median of Canadian towns; 4% have an Indigenous identity and 7% are immigrants.
How old are the people of Perth?
Half its people are older than 58.4 (the middle of Canadian towns: 45.2); children under 15 make up 11%, people 65 and over 39%.
What kind of homes are in Perth?
51% of homes are single-detached houses, against 64% for the median of Canadian towns, and 2% are in apartment buildings of five storeys or more. A household averages 1.9 people; 43% are one person living alone.
Sources: Statistics Canada, Census of Population 2021 · population estimates 2025 (17-10-0155) and 2021 census boundaries · Uniform Crime Reporting Survey 2023–25 (35-10-0026, 35-10-0183 to 35-10-0190) · CMHC rents as published by Statistics Canada (34-10-0133) · grades by TownRatings. Under the Statistics Canada Open Licence.
Adapted from Statistics Canada (Census of Population 2021, population estimates 2025, 2021 census boundaries) under the Statistics Canada Open Licence; this does not constitute an endorsement by Statistics Canada. Neighbourhood names in some cities © OpenStreetMap contributors (ODbL).