Guest, Sign inJoin
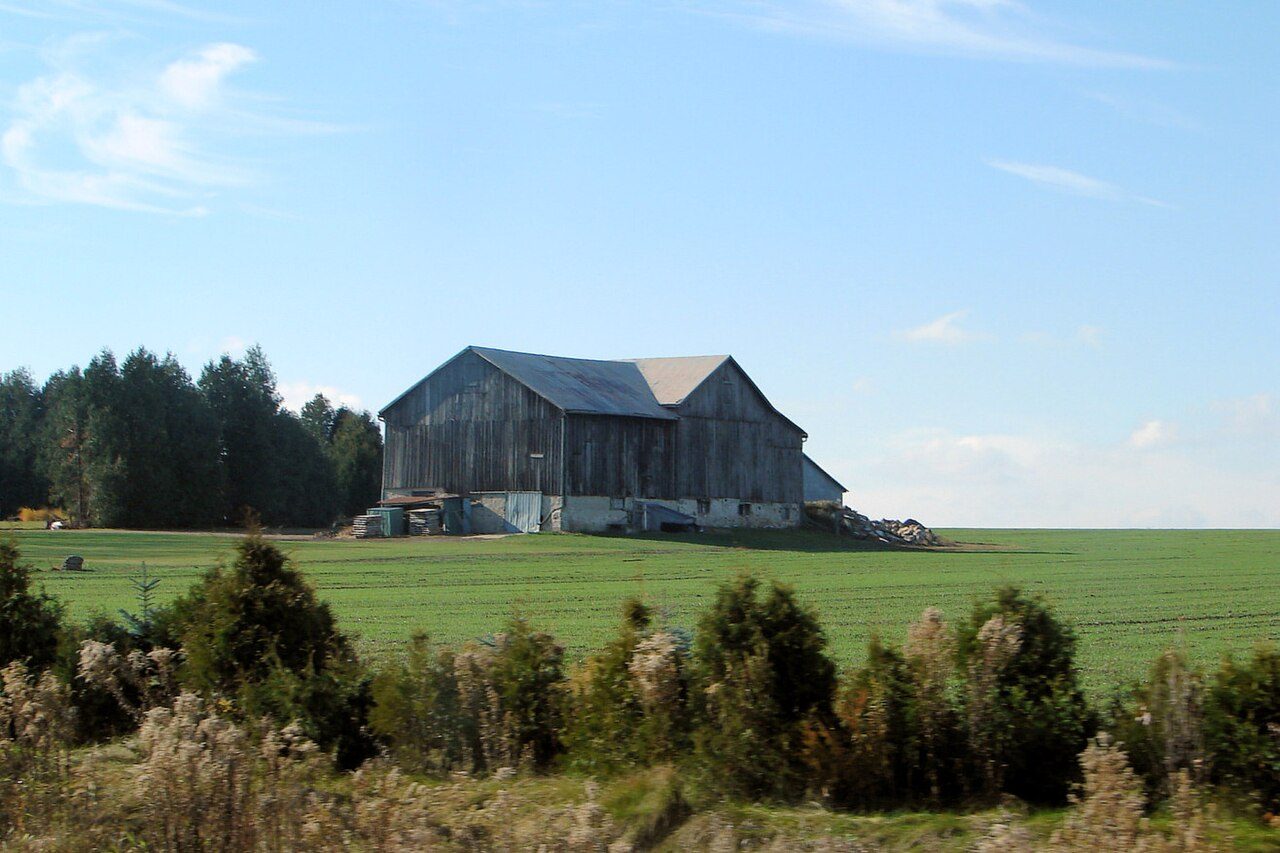
Mono ON 2Photo: P199 · CC BY-SA 3.0
BHealth Grade
Health in Mono · CCHS 2023/2024, Statistics Canada

Very good or excellent health for 51% of adults in Mono’s health region

Lives in the region last 82.4 years on average (2022/2024): 84.5 for women, 80.2 for men. What sets Mono apart within its region is a longer trip to hospital, 7.1 km for the average resident (3.7 km typical). The Health grade for Mono is B, #524 of 866 in Ontario and #1,612 of 2,583 Canadian towns.

Very good or excellent health
51%
adults, age-standardised
Ontario: 51% · Area-wide: very good or excellent health, chronic conditions, smokers and life expectancy, counted over the Wellington-Dufferin-Guelph Health Unit
Chronic conditions
17%
arthritis, diabetes, high blood pressure: average share
Ontario: 17%
Smokers
13%
daily or occasional, age-standardised
Ontario: 11%
Life expectancy
82.4
at birth, 2022/2024
women 84.5 · men 80.2
Nearest hospital
7.1 km
residents’ average, straight line
the typical Canadian town: 3.7 km
What stands out · In brief

What stands out about health in Mono

Fewer households under strain

With a situational-vulnerability score of 1.6 out of 5, Mono sits in the index’s least pressed areas. The wider area ↓

From Statistics Canada: the health survey and life expectancy for the health region, the deprivation index for the town; distances from the healthcare facilities database and OpenStreetMap.

Health Grade

Mono grades B for health

Each input ranked against Canadian towns of 2,500 or more: the region’s four, the town’s distance to a hospital.

Very good or excellent health (51%)Better than 44% of Canadian towns
Chronic conditions (17%)Better than 56% of Canadian towns
Smokers (13%)Better than 58% of Canadian towns
Life expectancy (82.4)Better than 79% of Canadian towns
Distance to a hospital (7.1 km)Better than 67% of Canadian towns

The region’s four figures and the town’s distance to a hospital are each ranked against Canadian towns of 2,500 or more, then averaged. Its place: #524 of 866 in Ontario and #1,612 of 2,583 Canadian towns.

How the grade works

Health is graded as a regional score, labelled as such: very good or excellent self-rated health, chronic conditions (arthritis, diabetes and high blood pressure averaged) and smoking from the Canadian Community Health Survey, each age-standardised so an older region isn’t marked down for age alone, and life expectancy at birth, all for the health region. The residents’ average distance to a hospital is the one input measured for the town itself, so towns in one region can still differ.

The wider area

Longest and shortest lives among the 34 regions in Ontario

Regional life expectancy in Ontario, then the town’s place on the national deprivation index.

82.4
years at birth, 2022/2024
20.9
more years expected at 65
8th
longest of 34 regions in Ontario

Life expectancy at birth by health region · 2022/2024

York Regional Health Unit86.3
Peel Regional Health Unit85.3
Halton Regional Health Unit84.9
City of Toronto Health Unit84.7
City of Ottawa Health Unit83.7
Waterloo Health Unit82.8
Durham Regional Health Unit82.6
Wellington-Dufferin-Guelph Health Unit82.4
Middlesex-London Health Unit81.9
Kingston, Frontenac and Lennox and Addington Health Unit81.8
Huron Perth Health Unit81.7
Simcoe Muskoka District Health Unit81.5
Grey Bruce Health Unit81.3
Windsor-Essex County Health Unit81.3
City of Hamilton Health Unit81.2
Leeds, Grenville and Lanark District Health Unit81.2
Niagara Regional Area Health Unit81.2
Haliburton, Kawartha, Pine Ridge District Health Unit81.0
Renfrew County and District Health Unit81.0
The Eastern Ontario Health Unit81.0
Oxford Elgin St. Thomas Health Unit80.6
Peterborough County—City Health Unit80.5
Brant County Health Unit80.4
Lambton Health Unit80.0
North Bay Parry Sound District Health Unit80.0
Hastings and Prince Edward Counties Health Unit79.8
Haldimand-Norfolk Health Unit79.6
Sudbury and District Health Unit79.1
Chatham-Kent Health Unit78.6
The District of Algoma Health Unit77.9
Porcupine Health Unit77.3
Timiskaming Health Unit77.0
Thunder Bay District Health Unit76.5
Northwestern Health Unit73.7

Life expectancy in Ontario runs from 73.7 to 86.3; this region sits 8th of the 34.

Canadian Index of Multiple Deprivation · national quintile, 1 least to 5 most deprived

Residential instability1.2
Economic dependency2.6
Ethno-cultural composition3.2
Situational vulnerability1.6

The index is context and never graded: it describes Mono’s own areas, averaged over residents, on each of its four dimensions.

Life expectancy: Statistics Canada table 13-10-0988, three-year estimate 2022/2024, by health region.

For its deprivation

Deprivation all but predicts the region’s life expectancy, which falls just short of the trend

Each dot is a health region, not a town, its figures shared by every town in it; Mono’s region sits on the trend line through 102 regions.

646872768084882345Eastern Urban Zone: 80.2 (women 82.1, men 78.2)Eastern Rural Zone: 78.6 (women 80.8, men 76.4)Central Zone: 79.0 (women 80.5, men 77.4)Western Zone: 78.5 (women 81.1, men 76.0)Labrador-Grenfell Zone: 77.1 (women 79.2, men 74.6)Prince Edward Island: 81.2 (women 83.3, men 79.1)Zone 1 - Western: 80.0 (women 82.5, men 77.6)Zone 2 - Northern: 79.3 (women 81.5, men 77.1)Zone 3 - Eastern: 78.8 (women 80.9, men 76.6)Zone 4 - Central: 81.4 (women 83.4, men 79.3)Zone 1 (Moncton area): 81.5 (women 83.5, men 79.5)Zone 2 (Saint John area): 79.3 (women 81.1, men 77.3)Zone 3 (Fredericton area): 80.1 (women 81.9, men 78.2)Zone 4 (Edmundston area): 79.1 (women 80.7, men 77.3)Zone 5 (Campbellton area): 79.0 (women 82.3, men 75.3)Zone 6 (Bathurst area): 80.2 (women 82.7, men 77.8)Zone 7 (Miramichi area): 78.9 (women 82.0, men 75.7)Région du Bas-Saint-Laurent: 81.7 (women 83.1, men 80.3)Région du Saguenay—Lac-Saint-Jean: 81.8 (women 83.2, men 80.4)Région de la Capitale-Nationale: 82.9 (women 84.7, men 81.1)Région de la Mauricie et du Centre-du-Québec: 81.6 (women 83.3, men 79.9)Région de l'Estrie: 82.9 (women 84.8, men 81.0)Région de Montréal: 83.4 (women 85.5, men 81.2)Région de l'Outaouais: 80.7 (women 82.2, men 79.1)Région de l'Abitibi-Témiscamingue: 79.5 (women 81.6, men 77.6)Région de la Côte-Nord: 79.4 (women 82.1, men 77.0)Région du Nord-du-Québec: 78.1 (women 78.5, men 77.6)Région de la Gaspésie—Îles-de-la-Madeleine: 79.9 (women 81.6, men 78.2)Région de la Chaudière-Appalaches: 82.8 (women 84.4, men 81.3)Région de Laval: 84.1 (women 85.7, men 82.4)Région de Lanaudière: 82.0 (women 83.7, men 80.3)Région des Laurentides: 82.2 (women 83.7, men 80.8)Région de la Montérégie: 82.5 (women 84.2, men 80.8)Région du Nunavik: 65.2 (women 70.3, men 60.7)Région des Terres-Cries-de-la-Baie-James: 76.8 (women 79.1, men 73.1)The District of Algoma Health Unit: 77.9 (women 80.4, men 75.6)Brant County Health Unit: 80.4 (women 82.6, men 78.2)Durham Regional Health Unit: 82.6 (women 84.7, men 80.5)Grey Bruce Health Unit: 81.3 (women 83.6, men 78.9)Haldimand-Norfolk Health Unit: 79.6 (women 81.9, men 77.6)Haliburton, Kawartha, Pine Ridge District Health Unit: 81.0 (women 83.0, men 79.0)Halton Regional Health Unit: 84.9 (women 86.5, men 83.2)City of Hamilton Health Unit: 81.2 (women 83.5, men 79.0)Hastings and Prince Edward Counties Health Unit: 79.8 (women 81.8, men 77.8)Chatham-Kent Health Unit: 78.6 (women 80.8, men 76.3)Kingston, Frontenac and Lennox and Addington Health Unit: 81.8 (women 83.9, men 79.5)Lambton Health Unit: 80.0 (women 82.2, men 77.8)Leeds, Grenville and Lanark District Health Unit: 81.2 (women 83.3, men 79.2)Middlesex-London Health Unit: 81.9 (women 84.2, men 79.6)Niagara Regional Area Health Unit: 81.2 (women 83.6, men 78.8)North Bay Parry Sound District Health Unit: 80.0 (women 82.6, men 77.6)Northwestern Health Unit: 73.7 (women 75.2, men 72.3)Huron Perth Health Unit: 81.7 (women 83.7, men 79.7)City of Ottawa Health Unit: 83.7 (women 85.7, men 81.6)Peel Regional Health Unit: 85.3 (women 87.2, men 83.3)Peterborough County—City Health Unit: 80.5 (women 82.8, men 78.1)Porcupine Health Unit: 77.3 (women 80.1, men 74.6)Renfrew County and District Health Unit: 81.0 (women 83.0, men 78.7)The Eastern Ontario Health Unit: 81.0 (women 83.0, men 78.9)Simcoe Muskoka District Health Unit: 81.5 (women 83.5, men 79.5)Sudbury and District Health Unit: 79.1 (women 82.0, men 76.3)Thunder Bay District Health Unit: 76.5 (women 79.0, men 74.1)Timiskaming Health Unit: 77.0 (women 80.3, men 73.6)Waterloo Health Unit: 82.8 (women 84.9, men 80.7)Wellington-Dufferin-Guelph Health Unit: 82.4 (women 84.5, men 80.2)Windsor-Essex County Health Unit: 81.3 (women 83.5, men 79.2)York Regional Health Unit: 86.3 (women 87.9, men 84.6)Oxford Elgin St. Thomas Health Unit: 80.6 (women 83.0, men 78.2)City of Toronto Health Unit: 84.7 (women 87.2, men 82.0)Winnipeg-Churchill Health Region: 80.0 (women 82.5, men 77.5)Prairie Mountain Health Region: 78.8 (women 81.2, men 76.6)Interlake-Eastern Health Region: 78.5 (women 81.3, men 76.0)Northern Health Region: 68.5 (women 70.5, men 66.9)Southern Health Region: 80.7 (women 82.9, men 78.7)Far North: 70.0 (women 72.8, men 67.3)North Central West: 76.6 (women 79.8, men 73.7)North Central East: 77.0 (women 79.6, men 74.5)Saskatoon: 81.4 (women 83.4, men 79.2)South West: 79.9 (women 82.5, men 77.5)South East: 78.6 (women 80.8, men 76.5)Regina: 80.2 (women 82.3, men 78.0)South Zone: 78.7 (women 80.6, men 76.8)Calgary Zone: 83.0 (women 85.0, men 80.9)Central Zone: 79.1 (women 81.7, men 76.6)Edmonton Zone: 81.2 (women 83.6, men 78.8)North Zone: 78.3 (women 80.9, men 76.1)East Kootenay Health Service Delivery Area: 80.5 (women 82.7, men 78.1)Kootenay-Boundary Health Service Delivery Area: 79.5 (women 82.8, men 76.5)Okanagan Health Service Delivery Area: 81.0 (women 84.1, men 78.2)Thompson/Cariboo Health Service Delivery Area: 78.8 (women 81.8, men 76.0)Fraser East Health Service Delivery Area: 80.0 (women 82.9, men 77.2)Fraser North Health Service Delivery Area: 84.4 (women 86.6, men 82.1)Fraser South Health Service Delivery Area: 83.2 (women 85.8, men 80.7)Richmond Health Service Delivery Area: 86.8 (women 89.0, men 84.4)Vancouver Health Service Delivery Area: 83.3 (women 86.5, men 80.2)North Shore/Coast Garibaldi Health Service Delivery Area: 84.3 (women 86.3, men 82.3)South Vancouver Island Health Service Delivery Area: 82.7 (women 84.9, men 80.5)Central Vancouver Island Health Service Delivery Area: 79.8 (women 82.6, men 77.1)North Vancouver Island Health Service Delivery Area: 79.5 (women 82.3, men 76.9)Northwest Health Service Delivery Area: 77.0 (women 79.2, men 75.0)Northern Interior Health Service Delivery Area: 76.6 (women 79.5, men 74.0)Northeast Health Service Delivery Area: 76.9 (women 79.5, men 74.4)Mono’s region 82.4
Situational vulnerability: residents’ average quintile, 1 least to 5 most deprivedLife expectancy at birth (years)

Canada’s 102 health regions show life expectancy dropping as deprivation climbs (correlation −0.83); a region scored 2.4 would be expected to reach 83.0 years, and Mono’s region is close, at 82.4. It is outlived by 8 of the 10 regions nearest it on the index, whose median is 83.0 years.

Life expectancy: Statistics Canada table 13-10-0988, 2022/2024, by health region. Deprivation: Canadian Index of Multiple Deprivation 2021 (situational vulnerability), averaged over each region’s towns by their residents; income: 2021 Census median household income, averaged the same way. The averages and the line are TownRatings calculations.

Conditions and habits

19% of the region’s adults have high blood pressure and 8.3% diabetes

What the survey finds on conditions, weight and habits for the region, the province as the tick.

Conditions and weight · 2023/2024

High blood pressure
19%
Arthritis
22%
Diabetes
8.3%
Obese (self-reported)
31%
Mood disorder
12%
Anxiety disorder
15%

Habits · 2023/2024

Smoke daily or now and then
13%
Smoke every day
9.5%
Heavy drinking
22%
Ontario

At 31%, self-reported obesity is near Ontario’s 30%. Heavy drinking runs above the province, 22% to 17%.

Canadian Community Health Survey 2023/2024 (table 13-10-0972), as published, not adjusted for age; obesity from reported height and weight. The anxiety disorder figure is the 2021/2022 estimate: Statistics Canada found the latest too unreliable to publish here.

Getting care

Getting to hospital from Mono: 7.1 km on average

Measured from where the town’s residents live, so this part is Mono’s own, not the region’s.

Hospital
7.1 km
residents’ average distance
the typical Canadian town: 3.7 km
Clinic
6.3 km
community health centre or clinic, residents’ average
Pharmacy
5.5 km
residents’ average distance
1.5 within 3 km of a typical home
More than 30 km from a hospital
0%
share of residents
Emergency
911
police, fire, ambulance; 811 for health advice in most provinces

Compared with 3.3 km for the typical town in Ontario and 3.7 km for the typical Canadian town, Mono is on the far side.

Hospitals and clinics: Statistics Canada, Open Database of Healthcare Facilities. Pharmacies: © OpenStreetMap contributors (ODbL). Straight-line distances from each dissemination area, weighted by its 2021 population.

Health survey

About as many rate their health highly here as in Ontario: 51% and 51%

How adults in the health region answered the survey, not adjusted for age; the tick marks the province.

Share of adults, as answered · 2023/2024

Health very good or excellent
51%
Health fair or poor
13%
Mental health very good or excellent
49%
Mental health fair or poor
15%
Most days quite a bit stressful
23%
Strong sense of belonging
65%
Satisfied with life
86%
Ontario

About as many adults report very good or excellent mental health as across Ontario (49% against 51%), while 23% call most days stressful.

Canadian Community Health Survey 2023/2024 (Statistics Canada table 13-10-0972), adults 18 and over, as published.

Towns its size

Further from a hospital than most towns its size: Mono comes 29th of 40

Ordered by residents’ distance to a hospital: 40 Canadian towns of 9,901 to 10,185 people, median 3.2 km.

#TownPeopleHospitalVery good health
1Lac-des-Fées QC B+10,0750.5 km55%
2Vincent ON B10,0111.1 km53%
3Bridle Path-Sunnybrook-York Mills ON A9,9091.2 km50%
27Palmerston ON B10,0296.6 km51%
28Mount Pleasant North ON B+10,1036.8 km49%
29Mono ON B10,0367.1 km51%
30Beckwith ON B−10,0737.2 km51%
31Stanley MB B−9,9298.0 km51%
40Leeds and the Thousand Islands ON C+10,18526 km51%

The region’s very good or excellent health column is regional: towns in one region share it.

Neighbours

Health in the places around Mono

Nearby places: distance to a hospital and each one’s regional figures. Tap a town for its health page.

ABCD
TownHospitalVery good healthLife exp.Health
Mono7.1 km51%82.4B
Orangeville
6.9 km
3.0 km51%82.4B+
Amaranth
12 km
15 km51%82.4B
Shelburne
17 km
21 km51%82.4B−
East Garafraxa
18 km
11 km51%82.4B

Every place around Mono shares its health region, so their survey figures match; only the distance to care differs. Residents of Shelburne live further from a hospital, at 21 km against 7.1 km in Mono.

How to read these numbers

What this data can and can’t tell you

  • Adjusted for age. Because older people report more illness, the grade uses age-standardised shares; the charts above show the unadjusted answers.
  • Deprivation is context. None of the four deprivation scores enters the grade; they come from the 2021 index, which skips the territories.
  • Distances are straight lines. A straight line from each neighbourhood’s centre to the nearest facility, weighted by who lives there, is shorter than any drive.
  • What counts as a hospital. Hospitals and clinics come from Statistics Canada’s facilities database, built from provincial lists of different dates, and a listed hospital may have no emergency department.
  • Regional figures. Only the distances on this page belong to Mono alone, because the health survey and life expectancy come for the whole health region.
  • Who the survey asks. People on reserves and in institutions, full-time military members and the residents of Nunavik and Eeyou Istchee aren’t interviewed by the survey.

Questions about health in Mono

How is Mono’s Health Grade worked out?

It will once Canada’s single grading run is done, measured on the region’s survey and life expectancy and on how far Mono’s homes are from a hospital, against the typical Canadian town.

What is the life expectancy in Mono?

Women in Mono’s region live to 84.5 on average and men to 80.2, Statistics Canada’s 2022/2024 estimate.

How far is Mono from a hospital?

Residents of Mono have a clinic 6.3 km away on average and a pharmacy 5.5 km away, in straight lines.

How healthy is Mono?

Taken together the region leans healthier than the typical Canadian town, but the picture is mixed. On arthritis, diabetes and high blood pressure, the region’s average share is 17%.

Sources: Statistics Canada, Canadian Community Health Survey 2023/2024 (13-10-0972) · Statistics Canada, life expectancy 2022/2024 (13-10-0988) · Statistics Canada, health regions 2023 (82-402-X) · Statistics Canada, Open Database of Healthcare Facilities · pharmacies © OpenStreetMap contributors (ODbL) · Statistics Canada, Canadian Index of Multiple Deprivation 2021. Under the Statistics Canada Open Licence.

Adapted from Statistics Canada (Census of Population 2021, population estimates 2025, 2021 census boundaries) under the Statistics Canada Open Licence; this does not constitute an endorsement by Statistics Canada. Neighbourhood names in some cities © OpenStreetMap contributors (ODbL).