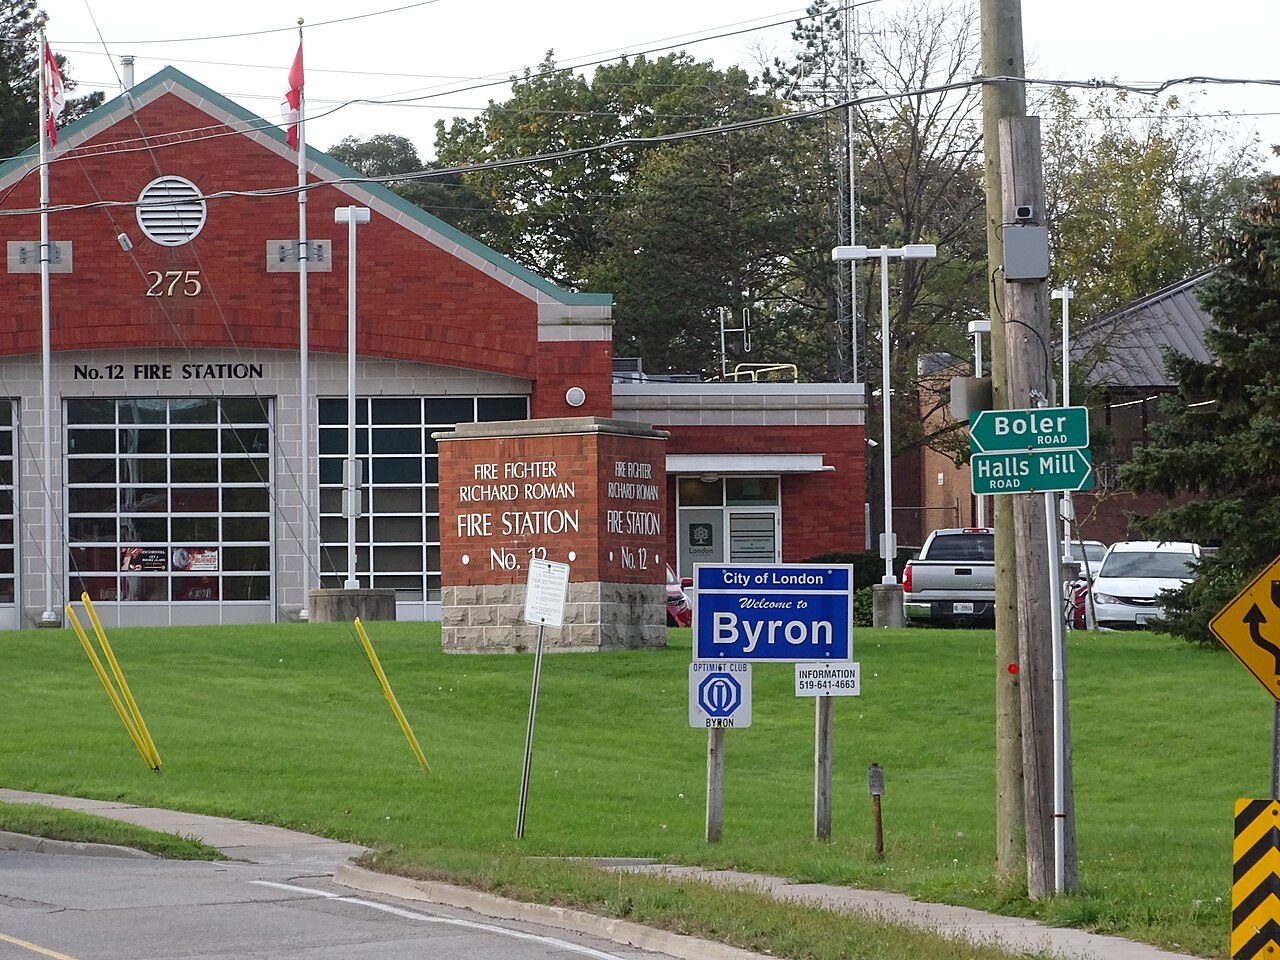
 Photo: Mosbo6 · CC BY-SA 4.0
One councillor per 32,990 residents: London is more thinly represented than 98% of Ontario municipalities
Byron is in London West, its riding (a federal electoral district, which elects one MP), and the seat belongs to Arielle Kayabaga of the Liberal Party of Canada. In the Legislative Assembly of Ontario, Byron belongs to London West; who holds it as MPP (Member of Provincial Parliament, at Queen’s Park in Toronto) isn’t on an open record, so no one is named. As a neighbourhood of London, Byron shares the council elected in October 2022, with Josh Morgan as mayor. These names are from the 2022–26 term: Ontario’s municipalities voted on 26 October 2026, but the province’s open list of the results isn’t out.
What stands out in how Byron is governed
Many residents per seat
London council spreads its seats over a big population; the typical municipality in Ontario has one seat per 1,540 residents. Council size ↓
Turnout below the norm
London council drew fewer of its electors to the polls in 2022 than the typical Ontario municipality (35%). How Byron voted ↓
Low spending per resident
In 2024, 75% of Ontario’s single-tier municipalities spent more per resident than London council. Council money ↓
A close federal race
With 4.4 points between the winner and the runner-up (Conservative Party of Canada), London West beat 89% of the 338 ridings for closeness in 2021. How Byron has voted ↓
Compared with the province’s municipalities of 1,000+ residents (2021 Census; MAMH, MMAH and Statistics Canada).
Three governments, and who does what
Byron is governed by London, with Ontario and Ottawa.
The city council decides local matters.
Schools, health care, highways, municipal law.
ola.org ↗Passports, pensions, EI, defence, immigration.
ourcommons.ca ↗Who to ask
Green: municipal. Gold: provincial. Grey: federal.
No county council governs London, a single-tier city, even if the census files it under Middlesex.
From the council table to Ottawa
Every elected tier that speaks for Byron, from the most recent elections.
- 1London councilelected October 2022Josh Morgan
- 2Legislative Assembly of OntarioLondon West
- 3House of CommonsLondon West
Party colours are neutral on purpose: they tell parties apart and aren’t the parties’ own. MPs: Wikidata (CC0), 45th Parliament statements, read 7 November 2026; ridings: 2023 Representation Order, Statistics Canada
Who was elected to London council in 2022
Everyone elected in 2022, with their votes; Ontario’s file gives each seat’s votes but not the ward’s name.
- Josh Morgan
- Steve Hillier
- Anna Hopkins
- Steve Lehman
- Shawn Lewis
- Elizabeth Peloza
- Paul Van Meerbergen
- Hadleigh McAlister
- Peter Cuddy
- Susan Stevenson
- Jerry Pribil
- Sam Trosow
- Corrine Rahman
- Skylar Franke
- David Ferreira
15 members and how they were elected
| Name | Seat | Votes | Share of the seat’s votes | On the last council |
|---|---|---|---|---|
| Josh Morgan | Mayor | 46,283 | 66% | Yes |
| Steve Hillier | Councillor | 1,766 | 46% | Yes |
| Anna Hopkins | Councillor | 4,281 | 62% | Yes |
| Steve Lehman | Councillor | 3,669 | 70% | Yes |
| Shawn Lewis | Councillor | 3,310 | 89% | Yes |
| Elizabeth Peloza | Councillor | 3,400 | 77% | Yes |
| Paul Van Meerbergen | Councillor | 2,400 | 42% | Yes |
| Hadleigh McAlister | Councillor | 1,415 | 38% | No |
| Peter Cuddy | Councillor | 1,433 | 36% | No |
| Susan Stevenson | Councillor | 1,064 | 28% | No |
| Jerry Pribil | Councillor | 3,982 | 65% | No |
| Sam Trosow | Councillor | 2,082 | 48% | No |
| Corrine Rahman | Councillor | 3,910 | 55% | No |
| Skylar Franke | Councillor | 3,616 | 58% | No |
| David Ferreira | Councillor | 1,885 | 41% | No |
Voters pick a mayor for the whole municipality and the rest of London council ward by ward. Josh Morgan became mayor on 66% of the votes cast.
Councils: Ontario 2022 Municipal Election data, MMAH (OGL-Ontario)
Byron voted less than most of Ontario in 2022
Turnout in the October 2022 municipal elections, beside nearby municipalities; the tick is Ontario’s median.
26% of those on the list cast a ballot for London council on 24 October 2022, fewer than in a typical municipality.
How Byron voted: same source as Councillors, above.
When Byron votes
The last and next general elections at each level; a by-election can come in between.
| Election | Last | Next |
|---|---|---|
| London council | 26 October 2026 | 28 October 2030 |
| Legislative Assembly of Ontario | 27 February 2025 | – |
| House of Commons | 28 April 2025 | – |
Why not 2025? Elections Canada publishes those counts under non-commercial terms, and its open data stop at the 2021 election. London votes next on 28 October 2030: the Municipal Elections Act, 1996 sets municipal elections on the fourth Monday in October every four years. Parliament was last elected on 28 April 2025, and the Legislative Assembly of Ontario on 27 February 2025.
Election dates: the legislatures, MMAH and MAMH
Byron votes in London West for the Legislative Assembly of Ontario
Provinces and territories run schools, health care and municipal law; each riding elects one MPP.
MPP: see the legislature’s list
ola.org ↗London West takes in Byron and elects its MPP to the Legislative Assembly of Ontario. The riding comes from the 2013 federal map, which southern Ontario’s provincial ridings match under the Representation Act, 2015.
Southern Ontario ridings: the 2013 federal boundaries (Representation Act, 2015), Statistics Canada
Arielle Kayabaga represents London West in Ottawa
Each riding elects one MP to the House of Commons; the general election of 28 April 2025 chose the 45th Parliament.
London West · Liberal Party of Canada · first elected 2021
en.wikipedia.org ↗- Liberal Party of Canada71
- Conservative Party of Canada50
As Wikidata records them.
The Liberal Party of Canada holds 71 of 122 seats from Ontario, including Arielle Kayabaga’s.
The MP’s record
Had the 2021 ballots been cast in today’s London West, the Liberal Party of Canada would have led with 37%; Arielle Kayabaga held it for them in 2025. First elected in 2021, Arielle Kayabaga is serving the 2nd term of a Commons career. Arielle Kayabaga has served as Deputy Leader of the Government in the House of Commons (since 2025).
MPs: Wikidata (CC0), 45th Parliament statements, read 7 November 2026; ridings: 2023 Representation Order, Statistics Canada · MPs’ records: Wikidata (CC0), positions held and party memberships, read 8 November 2026
London West stayed with the Liberal Party of Canada in 2021, electing Arielle Kayabaga
Results in London West as drawn in 2013, the boundaries of the 2019 and 2021 elections; the riding was redrawn for 2025.
In 2021, 68% of electors cast a ballot in London West, more than the national 63%. The Liberal Party of Canada held it before, with Kate Young elected in 2019 on 43%. Arielle Kayabaga (Liberal Party of Canada) took London West in 2021 with 37% of the vote, 3,035 votes ahead of Rob Flack (Conservative Party of Canada).
All 5 candidates in London West, 2021
| Candidate | Party | Votes | Share |
|---|---|---|---|
| Arielle Kayabaga | Liberal Party of Canada | 25,308 | 36.9% |
| Rob Flack | Conservative Party of Canada | 22,273 | 32.5% |
| Shawna Lewkowitz | New Democratic Party | 16,858 | 24.6% |
| Mike McMullen | People's Party of Canada | 3,409 | 5.0% |
| Jacques Y Boudreau | Libertarian Party of Canada | 773 | 1.1% |
Federal results: Elections Canada, 43rd and 44th general elections and the 44th’s transposition to the 2023 ridings, via open.canada.ca. Contains information licensed under the Open Government Licence – Canada
London council spends less per resident than most
The 2024 financial return: spending by service and revenue by source, per resident, compared only with Ontario’s single-tier municipalities.
Spending per resident by service, 2024
What pays for it
Shares of revenue, town and province.
At 44%, property taxes count for more of the revenue than the 37% seen across the province. Long-term debt at London council stood at $193.6M, or $417 a resident, below the $971 median. The return counts 3,724 full-time positions, 8.0 for every thousand residents. In 2024 the median among Ontario’s single-tier municipalities was $3,796 a resident; London council spent $3,235. Social services and child care takes the biggest share, 24%, or $776 per resident.
Every service line, 2024
| Service | 2024 | Per resident | Share |
|---|---|---|---|
| Social services and child care | $359.8M | $776 | 24% |
| Police, fire and protection | $301.3M | $650 | 20% |
| Roads and transit | $282.9M | $610 | 19% |
| Water, sewers and waste | $214.1M | $461 | 14% |
| Recreation and culture | $120M | $259 | 8% |
| Social housing | $78.4M | $169 | 5% |
| General government | $52.1M | $112 | 3% |
| Planning and development | $48.3M | $104 | 3% |
| Public health and paramedics | $43.6M | $94 | 3% |
Money: Financial Information Return 2024, Ontario Ministry of Municipal Affairs and Housing. Contains information licensed under the Open Government Licence – Ontario.
London council beside its neighbours
Residents (2021 Census) per council seat, head of council included, beside nearby municipalities; the tick is the provincial median.
The bars put the headline’s figure for London council next to nearby councils, the tick marking the provincial median.
Residents: 2021 Census; seats: the province’s council list
Having a say in how Byron is run
Check or update the federal list.
elections.ca ↗Every MP lists an office.
ourcommons.ca ↗Ridings, registration and voting dates.
elections.on.ca ↗What this data can and can’t tell you
- Which riding. Ridings are assigned from the 2021 Census: the one with most residents first, then any holding 5% or more.
- Election results. The 2019 and 2021 figures are Elections Canada’s official counts on the ridings drawn in 2013; the “today’s boundaries” figures are its transposition of the 2021 vote onto the 2023 ridings, an estimate built from polling divisions.
- Not on this page. No party tally for the council, which the open lists don’t record, and no band councils.
- Who holds each seat. A member who resigned or switched parties last week may still show here: the names are Wikidata’s.
- Council money. Figures are the 2024 Financial Information Return’s totals after adjustments, per resident on the return’s population. Lower tiers stand beside lower tiers only: their county or region spends on top.
- Council size. Seats count the head of council and the councillors, and residents are the 2021 Census count; a neighbourhood shows its city’s.
Questions about how Byron is run
Who is the MP for Byron?
Byron is in London West, represented by Arielle Kayabaga (Liberal Party of Canada).
Which party won Byron in the 2021 federal election?
Arielle Kayabaga (Liberal Party of Canada) took London West in 2021 and is its MP today.
Who is the MPP for Byron?
Byron votes in London West; the Legislative Assembly of Ontario’s members page gives its current MPP.
Who heads the council in London?
Josh Morgan was elected mayor in October 2022, for the 2022–26 term of London council.
How much does London council spend?
The 2024 return of London council shows $1.5 billion of spending for roughly 463,900 residents, $359.8M of it on social services and child care.
How is London council elected?
By ward for councillors and at large for the mayor, on London council.
What was the turnout in Byron?
In October 2022, turnout for London council was 25.5%, against 35.5% for the typical Ontario municipality.
Sources: MPs: Wikidata (CC0), 45th Parliament statements, read 7 November 2026; ridings: 2023 Representation Order, Statistics Canada · Southern Ontario ridings: the 2013 federal boundaries (Representation Act, 2015), Statistics Canada · Councils: Ontario 2022 Municipal Election data, MMAH (OGL-Ontario) · Money: Financial Information Return 2024, Ontario Ministry of Municipal Affairs and Housing. Contains information licensed under the Open Government Licence – Ontario. · Next municipal election: the province’s municipal election act · Municipality types: Statistics Canada census subdivisions · Federal results: Elections Canada, 43rd and 44th general elections and the 44th’s transposition to the 2023 ridings, via open.canada.ca. Contains information licensed under the Open Government Licence – Canada · MPs’ records: Wikidata (CC0), positions held and party memberships, read 8 November 2026. Under the Statistics Canada Open Licence.
Adapted from Statistics Canada (Census of Population 2021, population estimates 2025, 2021 census boundaries) under the Statistics Canada Open Licence; this does not constitute an endorsement by Statistics Canada. Neighbourhood names in some cities © OpenStreetMap contributors (ODbL).