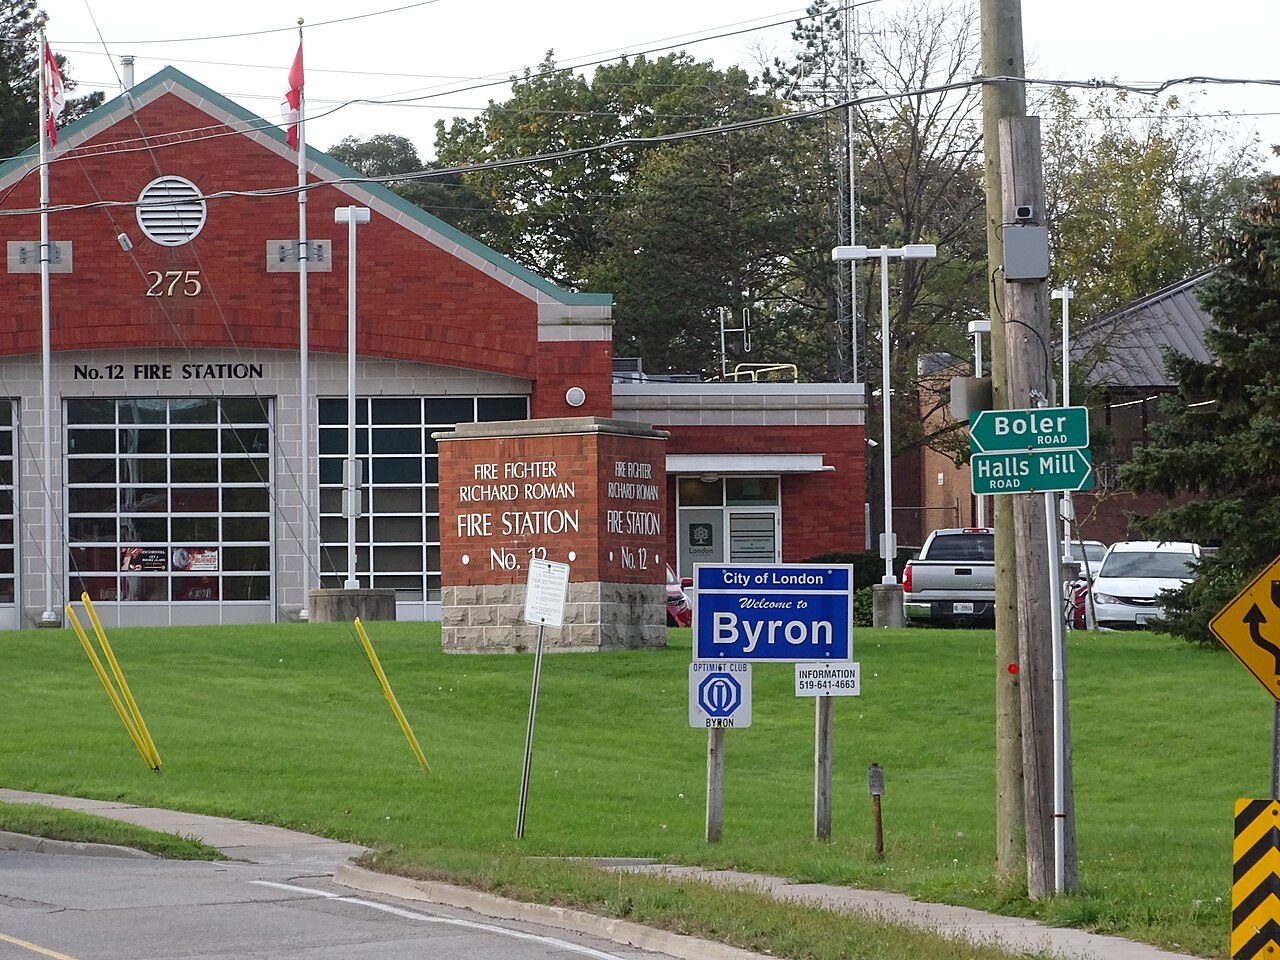
 Photo: Mosbo6 · CC BY-SA 4.0
Homes in Byron are worth a median $675,000
Behind it are the answers of 5,085 owners at the 2021 census. An owner’s figure, not a sale: the census of May 2021 asked what each home would fetch. Statistics Canada doesn’t publish sales in Ontario, so nothing here says what Byron’s homes actually sold for.
What Byron’s homes are worth, two ways
Two sources, each set against Ontario’s towns only: provinces measure value differently, so they don’t line up across borders. MPAC hasn’t reassessed since its 1 January 2016 values, which is why the figure sits well under the census value; it compares only within Ontario.
median, owners’ estimate
- Average
- $672K
- Owners
- 5,085
- Ontario’s towns
- $695K
- The typical Canadian town
- $406K
all residential, MPAC 2016 base
- Ontario’s towns
- $232K
Census 2021 (Statistics Canada); Canadian Housing Statistics Program, tables 46-10-0099 and 46-10-0093; Québec rôle d’évaluation foncière 2026 (MAMH). · Source area for assessed values, values by property type and building permits: the city of London
London’s houses carry 2.4 times the assessment of its condos
Of London’s 156,290 residential properties on the 2024 roll, 58% are detached houses and 22% are condos.
Median assessment by type, 2024 the tick is the median of Ontario’s towns
Canadian Housing Statistics Program, table 46-10-0093 (2024): residential properties on the assessment roll, vacant land left out. The ticks are the median of Ontario’s towns with their own figure; assessments compare within a province only.
How Byron’s homes break down, by age and kind
5,970 occupied homes stood in Byron in 2021, and single-detached houses made up 73% of them. At least half predate 2001. A neighbourhood’s counts are summed from small census areas, so its parts can fall a little short of the whole.
Homes by period of construction the tick is the median of Ontario’s towns
Homes by kind
| Byron | Ontario | Canada | |
|---|---|---|---|
| Condominiums | 20% | 7% | 8% |
| Needing major repairs | 2% | 6% | 6% |
| Too small for the household | 1% | 5% | 3% |
| Households in core housing need | 3% | 9% | 7% |
Census 2021 (Statistics Canada): occupied private dwellings; core housing need as Statistics Canada defines it. Ticks and columns are medians of the towns and neighbourhoods of 2,500 or more.
Permits in London ran at 16.7 homes a year per 1,000, near the 15 of Ontario’s towns
Over 2018–2023, 17,168 homes were permitted in London, close to 2,861 each year. 23% were single-unit buildings and the rest multi-unit ones, against 66% for Ontario’s towns.
Most in 2021: 3,998 new homes
New homes a year per 1,000 homes
Rising: 5,327 new homes in the 12 months to August 2026, 16% more
Shared with the rest of the London metro area: monthly permits
Statistics Canada, tables 46-10-0087 (building permits by census subdivision, 2018–2023: dwelling units created, new construction and conversions) and 34-10-0292 (monthly, metro areas). Per 1,000: units a year over 2019–2023 against occupied homes in 2021.
Byron sits near the middle of Ontario’s towns ($695,000)
871 of Ontario’s towns (2,500 people or more), by median value at the 2021 census, dearest first.
Census 2021, owners’ estimates; towns and neighbourhoods of 2,500 or more, no city as a whole, no reserve.
Lower values near Byron: Southcrest
The places around Byron at the 2021 census: median and average value, and how many own.
| Town | Median home value | Average | Owners | km |
|---|---|---|---|---|
| Byron | $675K | $672K | 85% | |
| Oakridge | $645K | $691K | 87% | 2.9 |
| Westmount | $650K | $679K | 63% | 3 |
| River Bend | $800K | $834K | 78% | 3.1 |
| Talbot | $800K | $921K | 74% | 3.5 |
| Southcrest | $424K | $423K | 38% | 4.6 |
| Hyde Park | $645K | $650K | 77% | 5.1 |
Census 2021 values; km.
Questions about property prices in Byron
How many households in Byron are in core housing need?
In Byron, 3% of households are in core housing need, against 9% for Ontario’s towns: those whose home costs too much, is too small or needs major repairs, with nothing suitable nearby under 30% of their income.
Is Byron expensive for Ontario?
On census values, Byron sits mid-table among Ontario’s towns (median $695,000).
Sources: Statistics Canada, Census of Population 2021 · Statistics Canada, Canadian Housing Statistics Program · Statistics Canada, building permits (tables 46-10-0087 and 34-10-0292). Under the Statistics Canada Open Licence.
Adapted from Statistics Canada (Census of Population 2021, population estimates 2025, 2021 census boundaries) under the Statistics Canada Open Licence; this does not constitute an endorsement by Statistics Canada. Neighbourhood names in some cities © OpenStreetMap contributors (ODbL).