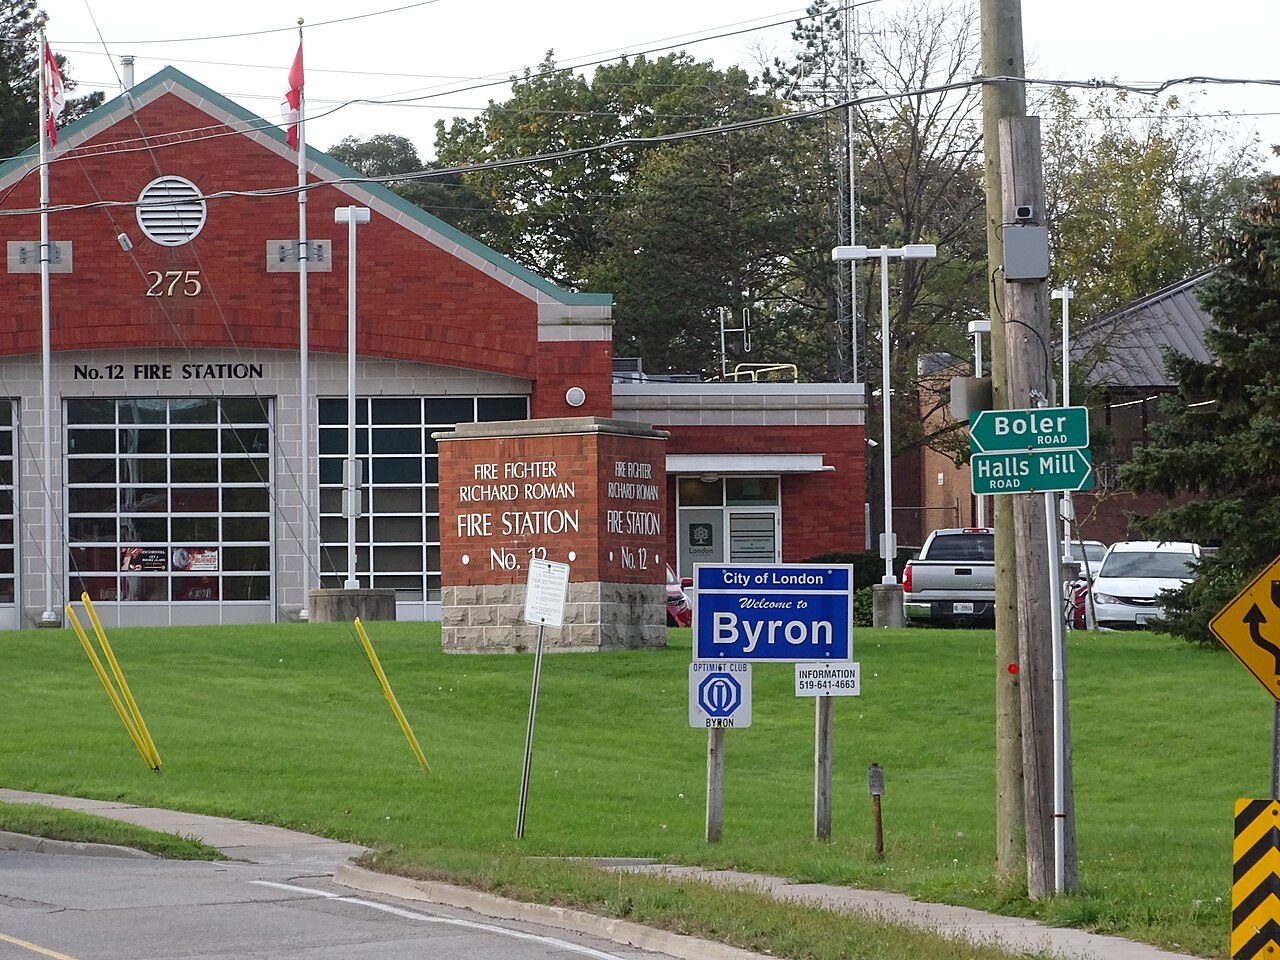
 Photo: Mosbo6 · CC BY-SA 4.0
Very good or excellent health for 52% of adults in Byron’s health region
Lives in the region last 81.9 years on average (2022/2024): 84.2 for women, 79.6 for men. Measured from where Byron’s residents live, the nearest hospital is 2.2 km away, under the typical 3.7 km. Health gives Byron a grade of A−, #425 of 866 in Ontario and #1,109 of 2,583 Canadian towns.
What stands out about health in Byron
Fewer households under strain
On the index’s situational vulnerability, which follows housing, income and education, Byron’s neighbourhoods average 1.4 out of 5, among the least deprived fifth of the country. The wider area ↓
Pharmacies close at hand
A typical home in Byron has 5.1 pharmacies within 3 km, the nearest 1.2 km away. Getting care ↓
Survey and life expectancy: the health region (Statistics Canada). Distances and deprivation: the town’s own areas.
Byron grades A− for health
Each input ranked against Canadian towns of 2,500 or more: the region’s four, the town’s distance to a hospital.
The region’s four figures and the town’s distance to a hospital are each ranked against Canadian towns of 2,500 or more, then averaged. Its place: #425 of 866 in Ontario and #1,109 of 2,583 Canadian towns.
How the grade works
Health is graded as a regional score, labelled as such: very good or excellent self-rated health, chronic conditions (arthritis, diabetes and high blood pressure averaged) and smoking from the Canadian Community Health Survey, each age-standardised so an older region isn’t marked down for age alone, and life expectancy at birth, all for the health region. The residents’ average distance to a hospital is the one input measured for the town itself, so towns in one region can still differ.
From Byron, a hospital is 2.2 km away on average
Straight-line distances from each part of Byron, weighted by who lives there.
Residents of Byron are closer than most of the province: the typical town in Ontario is 3.3 km from a hospital, the typical Canadian town 3.7 km.
Hospitals and clinics: Statistics Canada, Open Database of Healthcare Facilities. Pharmacies: © OpenStreetMap contributors (ODbL). Straight-line distances from each dissemination area, weighted by its 2021 population.
Longest and shortest lives among the 34 regions in Ontario
What Statistics Canada publishes above the town: life expectancy for each health region in Ontario, and the deprivation index for the town’s own areas.
Life expectancy at birth by health region · 2022/2024
Of the 34 health regions in Ontario, 9th place goes to this one, between a low of 73.7 and a high of 86.3.
Canadian Index of Multiple Deprivation · national quintile, 1 least to 5 most deprived
Statistics Canada scores every small area from 1 to 5 on each dimension; Byron’s bars are its residents’ average, shown and not graded.
Life expectancy: Statistics Canada table 13-10-0988, three-year estimate 2022/2024, by health region.
Deprivation all but predicts the region’s life expectancy, which edges past the trend
Every town shares its health region’s figures, so this compares 102 regions; the one holding Byron’s lies near the line.
At 2.7 on the index, regions tend to reach 81.9 years (correlation −0.83, 102 regions), and the one Byron belongs to reaches 81.9. The 10 regions scored most like it mostly do worse (7 of 10), with a median of 81.3. Income would point the wrong way: households in the region’s towns earn about $80,000, less than in most regions, yet lives here are longer than in most (across regions, income and life expectancy correlate at just 0.14).
Life expectancy: Statistics Canada table 13-10-0988, 2022/2024, by health region. Deprivation: Canadian Index of Multiple Deprivation 2021 (situational vulnerability), averaged over each region’s towns by their residents; income: 2021 Census median household income, averaged the same way. The averages and the line are TownRatings calculations.
In the region, high blood pressure (23%) and diabetes (7.4%)
What the survey finds on conditions, weight and habits for the region, the province as the tick.
Conditions and weight · 2023/2024
Habits · 2023/2024
Self-reported obesity, 33%, tops Ontario (30%). More adults drink heavily, 24% to the province’s 17%.
Canadian Community Health Survey 2023/2024 (table 13-10-0972), as published, not adjusted for age; obesity from reported height and weight. The anxiety disorder figure is the 2021/2022 estimate: Statistics Canada found the latest too unreliable to publish here.
About as many rate their health highly here as in Ontario: 53% and 51%
How adults in the health region answered the survey, not adjusted for age; the tick marks the province.
Share of adults, as answered · 2023/2024
About as many adults report very good or excellent mental health as across Ontario (53% against 51%), while 22% call most days stressful.
Canadian Community Health Survey 2023/2024 (Statistics Canada table 13-10-0972), adults 18 and over, as published.
Closer to a hospital than most towns its size: Byron comes 16th of 40
The 40 Canadian towns nearest its population (15,001 to 15,570 people), nearest a hospital first; their median is 3.1 km.
| # | Town | People | Hospital | Very good health |
|---|---|---|---|---|
| 1 | Lairet QC A+ | 15,251 | 1.2 km | 62% |
| 2 | Lawrence Park South ON A | 15,018 | 1.2 km | 50% |
| 3 | Edgemont AB A+ | 15,359 | 1.2 km | 56% |
| 14 | Lachute QC A+ | 15,469 | 2.1 km | 60% |
| 15 | Dupéré QC A | 15,036 | 2.1 km | 54% |
| 16 | Byron ON A− | 15,277 | 2.2 km | 52% |
| 17 | Pleasant View ON A | 15,248 | 2.5 km | 50% |
| 18 | Arbutus Ridge BC A+ | 15,083 | 2.5 km | 50% |
| 40 | Whistler BC A | 15,090 | 48 km | 59% |
The region’s very good or excellent health column is regional: towns in one region share it.
Health in the places around Byron
Nearby places: distance to a hospital and each one’s regional figures. Tap a town for its health page.
| Town | Hospital | Very good health | Life exp. | Health |
|---|---|---|---|---|
| Byron | 2.2 km | 52% | 81.9 | A− |
| Oakridge 2.9 km | 1.9 km | 52% | 81.9 | A− |
| Westmount 3.0 km | 3.6 km | 52% | 81.9 | B+ |
| River Bend 3.1 km | 2.2 km | 52% | 81.9 | A− |
| Talbot 3.5 km | 4.9 km | 52% | 81.9 | B+ |
| Southcrest 4.6 km | 2.7 km | 52% | 81.9 | A− |
| Hyde Park 5.1 km | 3.6 km | 52% | 81.9 | B+ |
The neighbours all sit in Byron’s health region, which is why their regional columns are identical.
What this data can and can’t tell you
- Regional figures. The survey figures and life expectancy are published for the health region, so every town in it shares them and only the distances are Byron’s own.
- Deprivation is context. None of the four deprivation scores enters the grade; they come from the 2021 index, which skips the territories.
- Distances are straight lines. A straight line from each neighbourhood’s centre to the nearest facility, weighted by who lives there, is shorter than any drive.
- Adjusted for age. Self-rated health, chronic conditions and smoking enter the grade adjusted to Canada’s adult age mix, though the survey block prints them as people answered.
- Who the survey asks. The health survey leaves out people living on reserves, full-time Canadian Forces members, people in institutions, and Nunavik and the Cree lands of James Bay.
- What counts as a hospital. Hospitals and clinics come from Statistics Canada’s facilities database, built from provincial lists of different dates, and a listed hospital may have no emergency department.
Questions about health in Byron
What is the life expectancy in Byron?
Life expectancy comes by health region: 84.2 for women, 79.6 for men around Byron (2022/2024).
How far is Byron from a hospital?
Beyond the hospital, the average home in Byron is 2.8 km from a clinic and 1.2 km from a pharmacy.
How healthy is Byron?
More of the region’s survey and life-expectancy figures beat the typical Canadian town than trail it. Chronic conditions there average 18% across arthritis, diabetes and high blood pressure.
How is Byron’s Health Grade worked out?
No letter yet for Byron: Canada is graded in one run, and Health will then compare its region and its access to care with the typical Canadian town.
Sources: Statistics Canada, Canadian Community Health Survey 2023/2024 (13-10-0972) · Statistics Canada, life expectancy 2022/2024 (13-10-0988) · Statistics Canada, health regions 2023 (82-402-X) · Statistics Canada, Open Database of Healthcare Facilities · pharmacies © OpenStreetMap contributors (ODbL) · Statistics Canada, Canadian Index of Multiple Deprivation 2021. Under the Statistics Canada Open Licence.
Adapted from Statistics Canada (Census of Population 2021, population estimates 2025, 2021 census boundaries) under the Statistics Canada Open Licence; this does not constitute an endorsement by Statistics Canada. Neighbourhood names in some cities © OpenStreetMap contributors (ODbL).