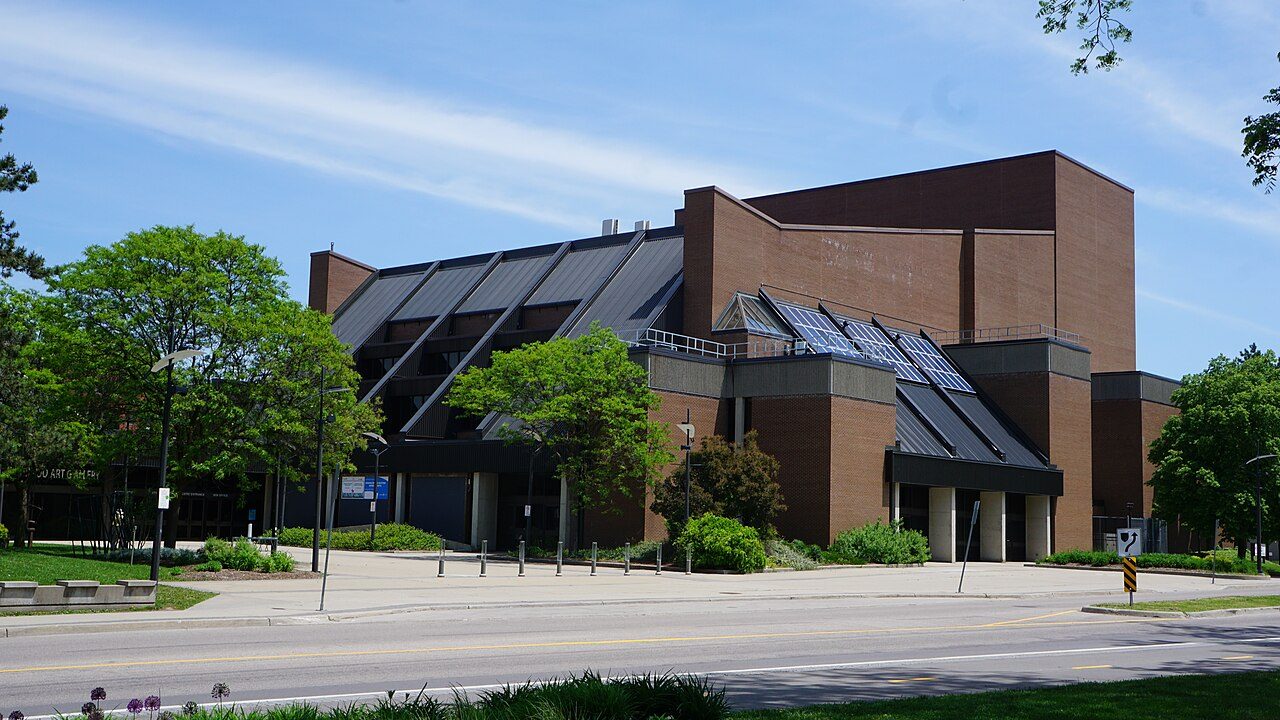
 Photo: JFVoll · CC BY-SA 4.0
Household incomes in Central Frederick are lower than in 65% of Canadian towns
Commutes from Central Frederick average 22.3 minutes, against 26 in the middle of Canadian towns. On census day, 33% of workers here were at home, next to 21% in the middle of Canadian towns. At the 2021 census, 76% of Central Frederick’s 15-to-64s were in work, against 73% in the middle of Canadian towns.
Central Frederick at work: what stands out
Lower incomes than most towns
Half of households had more than $70,700 before tax in 2020, where the middle of Canadian towns is $85,900. Household income ↓
Shorter trips than most towns
The average trip to work is 22.3 minutes; the middle of Canadian towns is 26. Getting to work ↓
Many work from home
33% of workers worked at home on census day, against 21% in the middle of Canadian towns. Getting to work ↓
Written from the data on this page: Statistics Canada’s 2021 Census, its commuting tables, Employment Insurance and the Labour Force Survey.
On jobs and income, Central Frederick grades B−
Better than 48% of Canadian towns on three measures together, #313 of 866 in Ontario.
Its strongest measure is trip times; its weakest, household income.
Graded against Canadian towns of 2,500 people or more; less unemployment and a shorter commute count in its favour.
How the grade works
Census 2021 measures, weighed equally against every Canadian town and neighbourhood of 2,500 people or more: the share of residents aged 15 to 64 in work, median household income (2020), the unemployment rate and the average commute. Each becomes a percentile; their average sets the letter.
Median household income in Central Frederick: $70,700 in 2020
Of the 42 other places of 2,500 or more in the Waterloo census division, 35 have a higher median. Central Frederick’s median is 23% below the middle of Ontario’s towns ($91,600). Pandemic benefits paid in 2020 lifted the incomes at the bottom, and they are counted here.
Statistics Canada, 2021 Census: median total income of households in 2020, before tax (a neighbourhood’s estimated from its dissemination areas’ income groups).
On foot, by bike, bus or train: 16% of Central Frederick’s commuters
By bus, train or subway: 7.9%, against 3.5% in the middle of Canadian towns. On foot: 6.7% of commuters, well above the 3.2% in the middle of Ontario’s towns. Fewer drive than in the middle of Ontario’s towns: 80% against 88%.
Statistics Canada, 2021 Census: main mode of commuting; average durations by mode from table 98-10-0458 (whole municipalities only).
Who in Central Frederick has a job
Of the 42 other places of 2,500 people or more in the Waterloo census division, 31 have a smaller share of 15-to-64s in work.
Working or looking, 69% of everyone 15 and over was in the labour force. An older population pulls the all-ages rate down: 61% of residents 15 and over were in work. The census caught the labour market on 11 May 2021, deep in the pandemic, so unemployment and working from home both ran above normal.
Statistics Canada, 2021 Census: people in work of any age over residents aged 15 to 64, and the census unemployment rate (15 and over); the 25-to-54 rate is Statistics Canada’s own (98-10-0485). The Labour Force Survey and business counts are context, not grade inputs.
47% more people are on EI in the Waterloo census division than in 2019
For each 100 residents of working age in the division, about 4.3 are on EI. Set against the same month a year before, the count in August 2026 rose by 2%. The highest month was April 2021: 28,950 people, 3 times the 2019 level.
Statistics Canada, Employment Insurance beneficiaries by census division (14-10-0323): all income benefits, not seasonally adjusted. Area behind the EI beneficiaries figures: the Waterloo census division. EI counts are context, not part of any grade.
People receiving Employment Insurance each month, as a share of the 2019 average (100).
Walking in Central Frederick earns A+
Better than 98% of Canadian towns on two measures together, #233 of 866 in Ontario.
OpenStreetMap (© OpenStreetMap contributors, ODbL); active commuting from the 2021 Census.
367th of 712: where Central Frederick ranks among Canadian towns of 4,100 to 8,000
| # | Place | People | In work, 15–64 | Unemployment | Household income | Grade |
|---|---|---|---|---|---|---|
| 1 | Labrador City Newfoundland and Labrador | 7,965 | 79% | 5.5% | $146K | A+ |
| 2 | Cornwallis Manitoba | 4,705 | 85% | 2.1% | $99K | A+ |
| 3 | New Maryland New Brunswick | 4,455 | 81% | 6.5% | $118K | A+ |
| … | ||||||
| 6 | Sioux Lookout Ontario | 6,122 | 79% | 5.7% | $103K | A+ |
| 7 | Red Lake Ontario | 4,285 | 77% | 5.1% | $111K | A+ |
| … | ||||||
| 9 | Island Park-Wellington Village Ontario | 5,486 | 81% | 7% | $161K | A+ |
| … | ||||||
| 365 | Fitzroy Ontario | 6,400 | 77% | 9.8% | $113K | B− |
| 366 | The Ravines of Rainbow Creek Ontario | 5,333 | 73% | 10% | $118K | B− |
| 367 | Central Frederick Ontario | 5,895 | 76% | 12% | $71K | B− |
| 368 | Aldergrove Alberta | 5,311 | 70% | 15% | $95K | B− |
| 369 | Osoyoos British Columbia | 5,724 | 74% | 12% | $66K | B− |
| … | ||||||
| 712 | Chertsey Quebec | 5,678 | 64% | 8.6% | $58K | D− |
Ordered by Jobs & income Grade: the top three, the places either side of Central Frederick, and others among Ontario’s towns.
Work in and around Central Frederick
| Place | In work, 15–64 | Unemployment | Household income | Average trip | Jobs | Walk |
|---|---|---|---|---|---|---|
| Central Frederick | 76% | 12% | $71K | 22.3 min | B− | A+ |
| Auditorium 0.8 km | 73% | 11% | $83K | 22.9 min | B | A |
| City Commercial Core 0.8 km | 78% | 8.6% | $68K | 22.6 min | B− | A+ |
| Cedar Hill 1.3 km | 67% | 11% | $51K | 25.4 min | D | A+ |
| Mt. Hope Huron Park 1.3 km | 74% | 10% | $75K | 23.7 min | C+ | A+ |
| Fairfield 1.3 km | 74% | 9.4% | $73K | 22.3 min | B− | A− |
| Mill Courtland Woodside Park 1.7 km | 72% | 13% | $71K | 24.1 min | C | A+ |
The people of each place: the share in work, unemployment, household income and the average commute, with both grades once they come.
What this data can and can’t tell you
What each figure measures for Central Frederick, where it comes from, and what it leaves out.
- Unemployment. A census-day figure: people without a job who were looking, divided by all those working or looking, ages 15 and up.
- Household income. Before-tax total income of the middle household for 2020, from the census. Neighbourhood medians are worked out from bracket counts, since Statistics Canada publishes none of their own.
- Trip times. The census asks how long the trip to work usually takes, in bands; our average uses each band’s middle, so it runs a little above Statistics Canada’s timed average.
- Employment Insurance. Monthly EI recipients across the census division: a pulse of the local job market rather than a measure of who is out of work.
- The Labour Force Survey. Sampled each month and released for regions rather than towns, so its rate describes the area around the town.
- In work. Why 15 to 64? Otherwise retirees would pull the rate down in older towns. The census can’t say how old a neighbourhood’s workers are, so the count of people in work takes every age.
- Which towns we compare. Any town of 2,500 or more counts, and so does any city neighbourhood that size; the city as a whole and First Nations reserves don’t. The middle is the median.
- Neighbourhood figures. We add up Central Frederick’s dissemination areas for its census figures. Flows between places and timed averages exist only for the whole municipality: see Kitchener’s page.
Questions about work in Central Frederick
What is the average household income in Central Frederick?
The median household in Central Frederick had $70,700 before tax in 2020, against $85,900 in the middle of Canadian towns.
How do people in Central Frederick get to work?
By car: 80% of commuters, 7.9% take public transit, 6.7% walk and 1% cycle; on census day 33% of those in work worked from home.
How many jobs are there in Central Frederick?
There is no count for a neighbourhood: the jobs figure, and where commuters go, are published for Kitchener as one municipality.
What is the unemployment rate in Central Frederick?
The census put unemployment at 12% in May 2021, where the middle of Canadian towns was 9.9%. More recently, in October 2026, the Labour Force Survey had the Kitchener-Cambridge-Waterloo metro area at 7.1%.
Sources: Statistics Canada, 2021 Census of Population (Census Profile) · Statistics Canada, table 14-10-0323 (EI beneficiaries) · Statistics Canada, Labour Force Survey (14-10-0459, 14-10-0462) · Statistics Canada, Canadian Business Counts (33-10-1176) · grades: TownRatings. Under the Statistics Canada Open Licence.
Adapted from Statistics Canada (Census of Population 2021, population estimates 2025, 2021 census boundaries) under the Statistics Canada Open Licence; this does not constitute an endorsement by Statistics Canada. Neighbourhood names in some cities © OpenStreetMap contributors (ODbL).