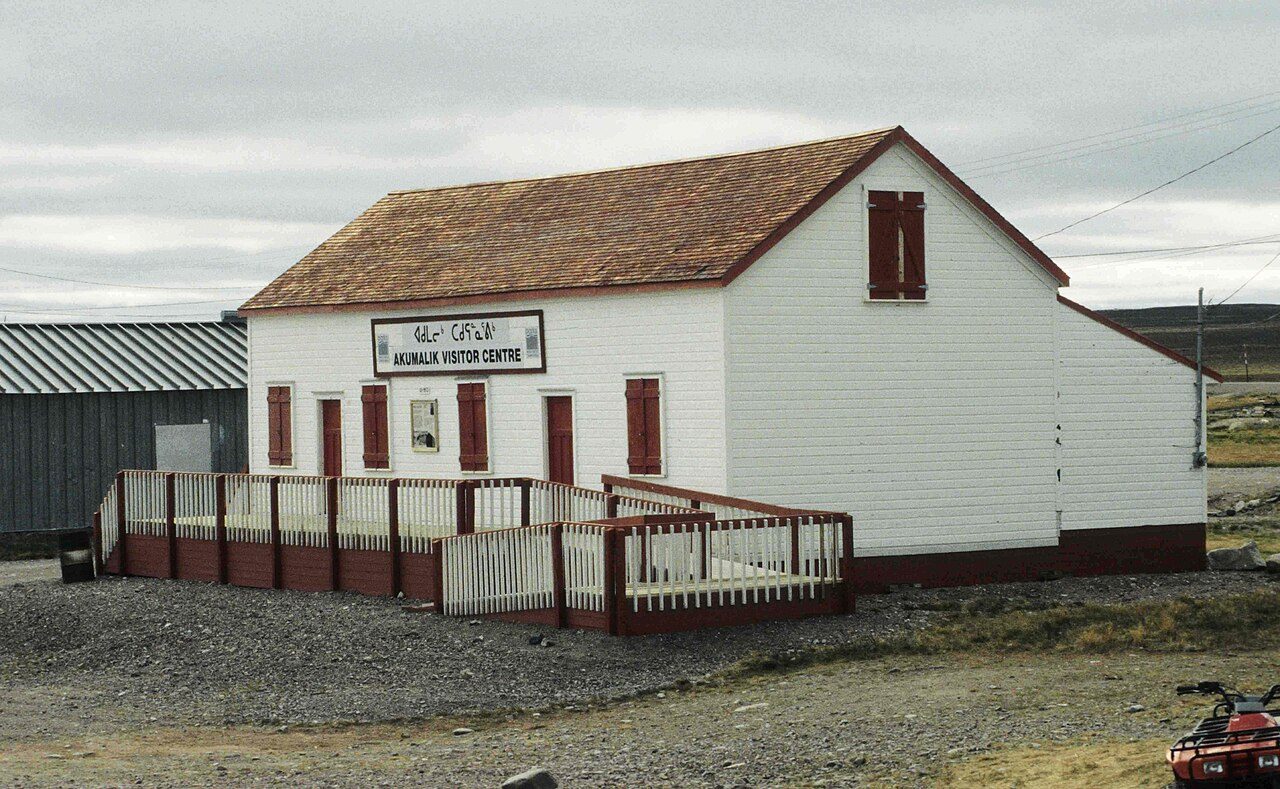
 Photo: Ansgar Walk · CC BY-SA 2.5
Almost every Canadian town has more of its working-age people in jobs than Baker Lake
When the 2021 census was taken, 27% of people in Baker Lake who wanted a job had none; the middle of Canadian towns is 9.9%. Workers in Baker Lake spend 11.9 minutes on the way to work on average, and 3.8% need an hour or more. Median household income in Baker Lake was $102,700 in 2020, next to $85,900 for the middle of Canadian towns.
Jobs and income in Baker Lake: what the figures say
Fewer people in work than most towns
At the 2021 census 43% of the 15-to-64s were in work (73% in the middle of Canadian towns); across all ages 15 and over, 40%. In work ↓
More unemployment than most towns
Unemployment stood at 27% on census day in 2021 (9.9% in the middle of Canadian towns). Unemployment ↓
Higher incomes than most towns
Household income at the median was $102,700 in 2020, before tax; Canadian towns have $85,900 at the middle. Household income ↓
More jobs than the typical town
495 people work in Baker Lake and 455 residents commute to a fixed workplace; the middle of Canadian towns has 0.8 jobs per working resident. The daily tide ↓
Shorter trips than most towns
Commutes take 11.9 minutes on average, against 26 in the middle of Canadian towns; 3.8% take an hour or more. The trip to work ↓
Written from the data on this page: Statistics Canada’s 2021 Census, its commuting tables, Employment Insurance and the Labour Force Survey.
The Jobs & income grade for Baker Lake: B+
Better than 73% of Canadian towns on three measures together.
Its strongest measure is trip times; its weakest, the share of 15-to-64s in work.
Graded against Canadian towns of 2,500 people or more; less unemployment and a shorter commute count in its favour.
How the grade works
Census 2021 measures, weighed equally against every Canadian town and neighbourhood of 2,500 people or more: the share of residents aged 15 to 64 in work, median household income (2020), the unemployment rate and the average commute. Each becomes a percentile; their average sets the letter.
How many in Baker Lake have a job: 43% of 15-to-64s
Working or looking, 55% of everyone 15 and over was in the labour force. Pandemic rules were in force on census day, 11 May 2021; the Labour Force Survey shows how jobs have moved since.
Statistics Canada, 2021 Census: people in work of any age over residents aged 15 to 64, and the census unemployment rate (15 and over); the 25-to-54 rate is Statistics Canada’s own (98-10-0485). The Labour Force Survey and business counts are context, not grade inputs.
A smaller share in work than in almost any Canadian town.
How Baker Lake’s household incomes compare
Before tax, 2020: higher than in 88% of Canadian towns.
In 2020 emergency benefits topped up many low incomes, and the census counts them here.
Statistics Canada, 2021 Census: median total income of households in 2020, before tax (a neighbourhood’s estimated from its dissemination areas’ income groups).
Every working day, Baker Lake’s workforce grows by 8%
For every resident who leaves Baker Lake for work, about 2 people come in. Of those who commute, 93% stay within the municipality; the middle of Canadian towns is 70%.
People with no fixed workplace are in neither count.
Time on the road to work from Baker Lake
Statistics Canada’s own average, timed exactly rather than by band, is 12.4 minutes. Trips under 15 minutes: 86%, more than the 36% in the middle of Canadian towns.
Statistics Canada, 2021 Census: commuting duration in five bands; our average uses each band’s middle (75 minutes for an hour or more), so it runs about two minutes above Statistics Canada’s own.
74 people come into Baker Lake to work, most from Pond Inlet and Arviat
- Pond Inlet30
- Arviat20
- Whale Cove10
- Pond Inlet10
- Arviat10
Of everyone working in Baker Lake, 15% come in from elsewhere; 30 make the 1,177 km trip from Pond Inlet. Pond Inlet is where the largest group of commuters out goes, 10 of them.
Statistics Canada, 2021 Census (98-10-0459): commuting flows between municipalities (census subdivisions), rounded to 5; linked names have their own pages.
Walk, cycle or ride transit: the choice of 33% of Baker Lake’s commuters
Fewer worked at home than in the middle of Canadian towns: 5.4% against 21%. Transit takes 1.9% of commuters, against 3.5% in the middle of Canadian towns. On foot: 31% of commuters, well above the 3.4% in the middle of Canadian towns. 53% drive to work, fewer than the 89% in the middle of Canadian towns.
Statistics Canada, 2021 Census: main mode of commuting; average durations by mode from table 98-10-0458 (whole municipalities only).
In the Kivalliq census division, 4% fewer people receive EI than in 2019
That is about 3.4 people on EI for every 100 aged 15 to 64 in the division. Over the year to August 2026, the count fell by 12%. June 2021 was the busiest month, with 510 people on EI, 2.1 times 2019’s average.
Statistics Canada, Employment Insurance beneficiaries by census division (14-10-0323): all income benefits, not seasonally adjusted. EI counts are context, not part of any grade.
People receiving Employment Insurance each month, as a share of the 2019 average (100). Nobody publishes EI beneficiaries for Baker Lake alone, so this card uses the figure for the Kivalliq census division.
Getting around Baker Lake on foot earns A+
Better than 95% of Canadian towns on two measures together.
OpenStreetMap (© OpenStreetMap contributors, ODbL); active commuting from the 2021 Census.
What this data can and can’t tell you
What each figure measures for Baker Lake, where it comes from, and what it leaves out.
- In work. Why 15 to 64? Otherwise retirees would pull the rate down in older towns. The census can’t say how old a neighbourhood’s workers are, so the count of people in work takes every age.
- Unemployment. Of everyone 15 or older who was working or job-hunting in the census week, the part still looking. Someone not seeking work isn’t in it at all.
- Household income. The census median total income of households in 2020, before tax; a neighbourhood’s is estimated from its dissemination areas’ income groups.
- Trip times. How long getting to work normally takes, averaged from the census’s time bands at their middles; expect it to read slightly high against the timed figure.
- Where people commute. Jobs count everyone whose usual workplace lies in the municipality, residents or commuters from elsewhere, from Statistics Canada’s home-by-workplace table.
- Employment Insurance. Statistics Canada counts EI beneficiaries each month by census division. Seasonal work makes it swing, so read it as a trend, not a jobless rate.
- Which towns we compare. Comparisons are with the median of Canadian towns and city neighbourhoods counting 2,500 people or more, reserves and entire cities excluded.
Questions about work in Baker Lake
How many jobs are there in Baker Lake?
The 2021 census counted about 495 people working in Baker Lake: 1.1 jobs for every resident who commutes to a fixed workplace. Statistics Canada counted 29 businesses with employees in June 2026.
What is the unemployment rate in Baker Lake?
About 27%, by the census of May 2021, against 9.9% in the middle of Canadian towns.
What is the average household income in Baker Lake?
At $102,700 before tax in 2020, the median household in Baker Lake compares with $85,900 in the middle of Canadian towns.
How do people in Baker Lake get to work?
By car: 53% of commuters, 1.9% take public transit and 31% walk; on census day 5.4% of those in work worked from home.
How long is the commute from Baker Lake?
11.9 minutes is the average trip, with 86% of commuters there in under 15 minutes and 3.8% taking an hour or more.
Where do people in Baker Lake work?
93% work in Baker Lake itself; of those who leave, the most go to Pond Inlet (10), then Arviat (10).
Sources: Statistics Canada, 2021 Census of Population (Census Profile) · Statistics Canada, tables 98-10-0458 and 98-10-0459 (commuting) · Statistics Canada, table 14-10-0323 (EI beneficiaries) · Statistics Canada, Canadian Business Counts (33-10-1176) · grades: TownRatings. Under the Statistics Canada Open Licence.
Adapted from Statistics Canada (Census of Population 2021, population estimates 2025, 2021 census boundaries) under the Statistics Canada Open Licence; this does not constitute an endorsement by Statistics Canada. Neighbourhood names in some cities © OpenStreetMap contributors (ODbL).