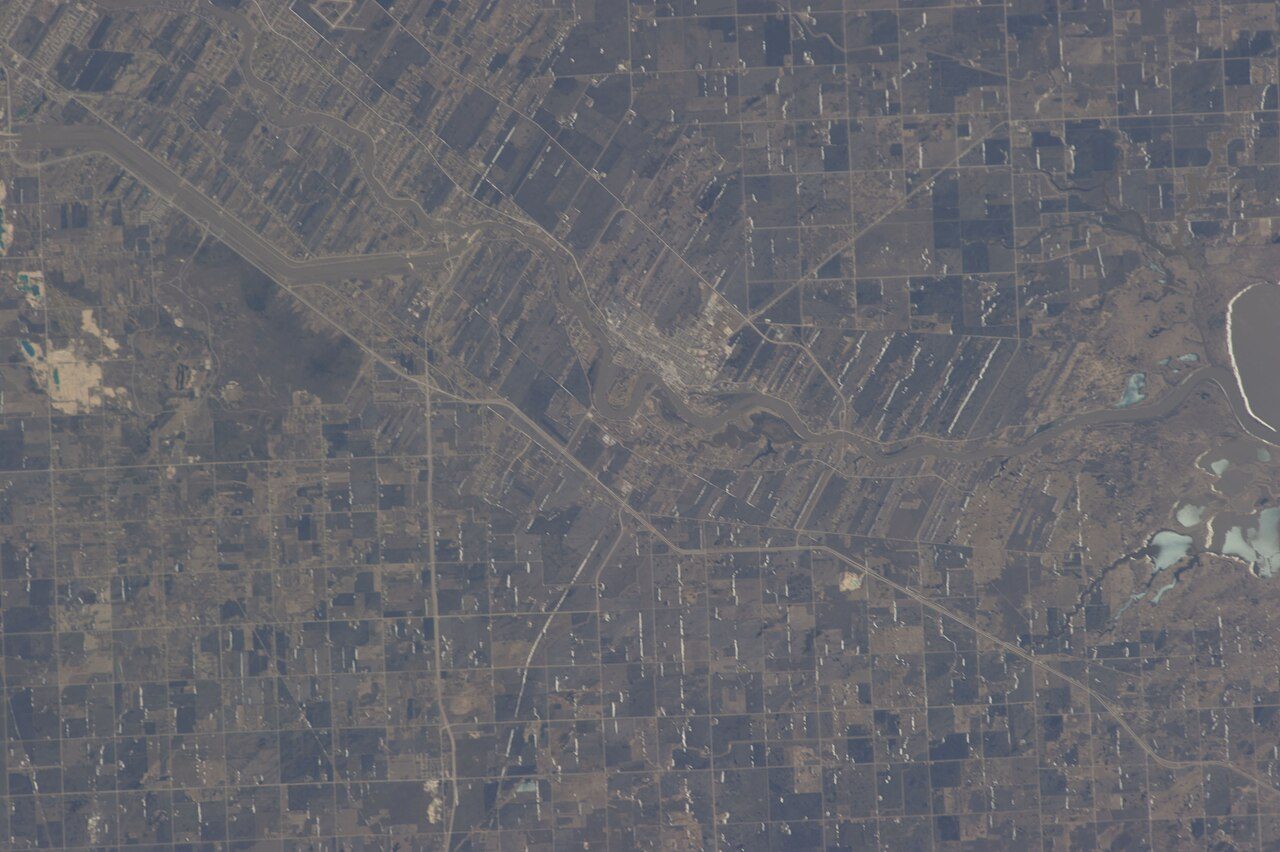
 Photo: Earth Science and Remote Sensing Unit , Lyndon B. Johnson Space Center · Public domain
For health, Division No. 1, Unorganized sits behind 95% of Canadian towns
On self-rated health the region tracks the province: 50% very good or excellent, 51% for Manitoba. Closer to home, a hospital is 50 km from the average resident of Division No. 1, Unorganized, and 100% live more than 30 km away. Health gives Division No. 1, Unorganized a grade of D.
What stands out about health in Division No. 1, Unorganized
Shorter lives in the region
Born around Division No. 1, Unorganized, a child can expect 3.0 fewer years than in the typical Canadian town’s region; at 65, another 20.2 (2022/2024). The wider area ↓
Hospital care at a distance
Residents of Division No. 1, Unorganized live much further from a hospital than in the typical Canadian town (50 km from its centre of population), and 100% are more than 30 km away. Getting care ↓
More smokers
Around Division No. 1, Unorganized, 14% of adults smoke daily, part of a smoking rate higher than most Canadian towns’ regions. Conditions and habits ↓
A long way to a pharmacy
The nearest pharmacy on OpenStreetMap is 45 km from the average home in Division No. 1, Unorganized, so prescriptions mean a drive. Getting care ↓
From Statistics Canada: the health survey and life expectancy for the health region, the deprivation index for the town; distances from the healthcare facilities database and OpenStreetMap.
Division No. 1, Unorganized grades D for health
Each input ranked against Canadian towns of 2,500 or more: the region’s four, the town’s distance to a hospital.
The region’s four figures and the town’s distance to a hospital are each ranked against Canadian towns of 2,500 or more, then averaged.
How the grade works
Health is graded as a regional score, labelled as such: very good or excellent self-rated health, chronic conditions (arthritis, diabetes and high blood pressure averaged) and smoking from the Canadian Community Health Survey, each age-standardised so an older region isn’t marked down for age alone, and life expectancy at birth, all for the health region. The residents’ average distance to a hospital is the one input measured for the town itself, so towns in one region can still differ.
Longest and shortest lives among the 5 regions in Manitoba
Regional life expectancy in Manitoba, then the town’s place on the national deprivation index.
Life expectancy at birth by health region · 2022/2024
Ranked 4th of 5 in Manitoba: the regions span 68.5 to 80.7 years at birth.
Canadian Index of Multiple Deprivation · national quintile, 1 least to 5 most deprived
The index is context and never graded: it describes Division No. 1, Unorganized’s own areas, averaged over residents, on each of its four dimensions.
Life expectancy: Statistics Canada table 13-10-0988, three-year estimate 2022/2024, by health region.
The nearest hospital is 50 km from the average home in Division No. 1, Unorganized
Measured from where the town’s residents live, so this part is Division No. 1, Unorganized’s own, not the region’s.
Compared with 3.1 km for the typical town in Manitoba and 3.7 km for the typical Canadian town, Division No. 1, Unorganized is on the far side. Few clinics are listed in Manitoba, so the distance to one reads longer than it is.
Hospitals and clinics: Statistics Canada, Open Database of Healthcare Facilities. Pharmacies: © OpenStreetMap contributors (ODbL). Straight-line distances from each dissemination area, weighted by its 2021 population.
High blood pressure for 29% of adults in the region, diabetes for 9.8%
What the survey finds on conditions, weight and habits for the region, the province as the tick.
Conditions and weight · 2023/2024
Habits · 2023/2024
More adults report obesity than across Manitoba: 43%, the province 36%. At 29%, heavy drinking beats the provincial 21%.
Canadian Community Health Survey 2023/2024 (table 13-10-0972), as published, not adjusted for age; obesity from reported height and weight.
Longer lives than deprivation would give: 0.9 years ahead of the trend
These are health regions, 102 of them, not towns: the survey and life expectancy are published that way, so the dot for Division No. 1, Unorganized’s region, above the line, stands for every town in it.
Measured against 102 regions, more deprivation means shorter lives, and steadily so (correlation −0.83). Division No. 1, Unorganized’s region, at 3.9, outlives the trend’s 77.6 years with 78.5. Among its 10 nearest neighbours on the index it sits mid-table: 5 above, 5 below, a median of 78.5 years. Higher incomes, shorter lives: about $84,000 a household, above most regions’, with a life expectancy below most; income and lifespan correlate at only 0.14 across regions.
Life expectancy: Statistics Canada table 13-10-0988, 2022/2024, by health region. Deprivation: Canadian Index of Multiple Deprivation 2021 (situational vulnerability), averaged over each region’s towns by their residents; income: 2021 Census median household income, averaged the same way. The averages and the line are TownRatings calculations.
49% in the region call their health very good or excellent, fewer than in Manitoba (52%)
How adults in the health region answered the survey, not adjusted for age; the tick marks the province.
Share of adults, as answered · 2023/2024
On mental health the region is behind Manitoba, 49% very good or excellent to 52%; 17% describe most days as quite a bit stressful.
Canadian Community Health Survey 2023/2024 (Statistics Canada table 13-10-0972), adults 18 and over, as published.
What this data can and can’t tell you
- Two regions. About 33% of Division No. 1, Unorganized’s residents live in Southern Health Region, a second health region; the page shows the region most residents live in.
- Adjusted for age. Standardising for age lets a retirement region and a young one be set side by side; the charts keep the raw answers, the grade the standardised ones.
- Who the survey asks. The survey’s frame skips reserves and other Indigenous settlements, institutions, the Forces and two Québec regions, so their figures come from elsewhere or not at all.
- What counts as a hospital. A “hospital” here is whatever the provinces listed as one in Statistics Canada’s database, which can mean a site without an emergency department.
- Distances are straight lines. Roads, rivers and ferries aren’t in it: the figure is a straight line from where people live, averaged over residents.
- Deprivation is context. Deprivation is shown to set the scene and doesn’t count toward the grade; Statistics Canada left the territories out of the index.
- Regional figures. The survey figures and life expectancy are published for the health region, so every town in it shares them and only the distances are Division No. 1, Unorganized’s own.
Questions about health in Division No. 1, Unorganized
How far is Division No. 1, Unorganized from a hospital?
A pharmacy is 45 km from the average resident of Division No. 1, Unorganized, as the crow flies; clinic lists here are too thin to measure.
What is the life expectancy in Division No. 1, Unorganized?
Life expectancy comes by health region: 81.3 for women, 76.0 for men around Division No. 1, Unorganized (2022/2024).
How healthy is Division No. 1, Unorganized?
The region trails the typical Canadian town on each of its four survey and life-expectancy figures. On arthritis, diabetes and high blood pressure, the region’s average share is 20%.
How is Division No. 1, Unorganized’s Health Grade worked out?
No letter yet for Division No. 1, Unorganized: Canada is graded in one run, and Health will then compare its region and its access to care with the typical Canadian town.
Sources: Statistics Canada, Canadian Community Health Survey 2023/2024 (13-10-0972) · Statistics Canada, life expectancy 2022/2024 (13-10-0988) · Statistics Canada, health regions 2023 (82-402-X) · Statistics Canada, Open Database of Healthcare Facilities · pharmacies © OpenStreetMap contributors (ODbL) · Statistics Canada, Canadian Index of Multiple Deprivation 2021. Under the Statistics Canada Open Licence.
Adapted from Statistics Canada (Census of Population 2021, population estimates 2025, 2021 census boundaries) under the Statistics Canada Open Licence; this does not constitute an endorsement by Statistics Canada. Neighbourhood names in some cities © OpenStreetMap contributors (ODbL).