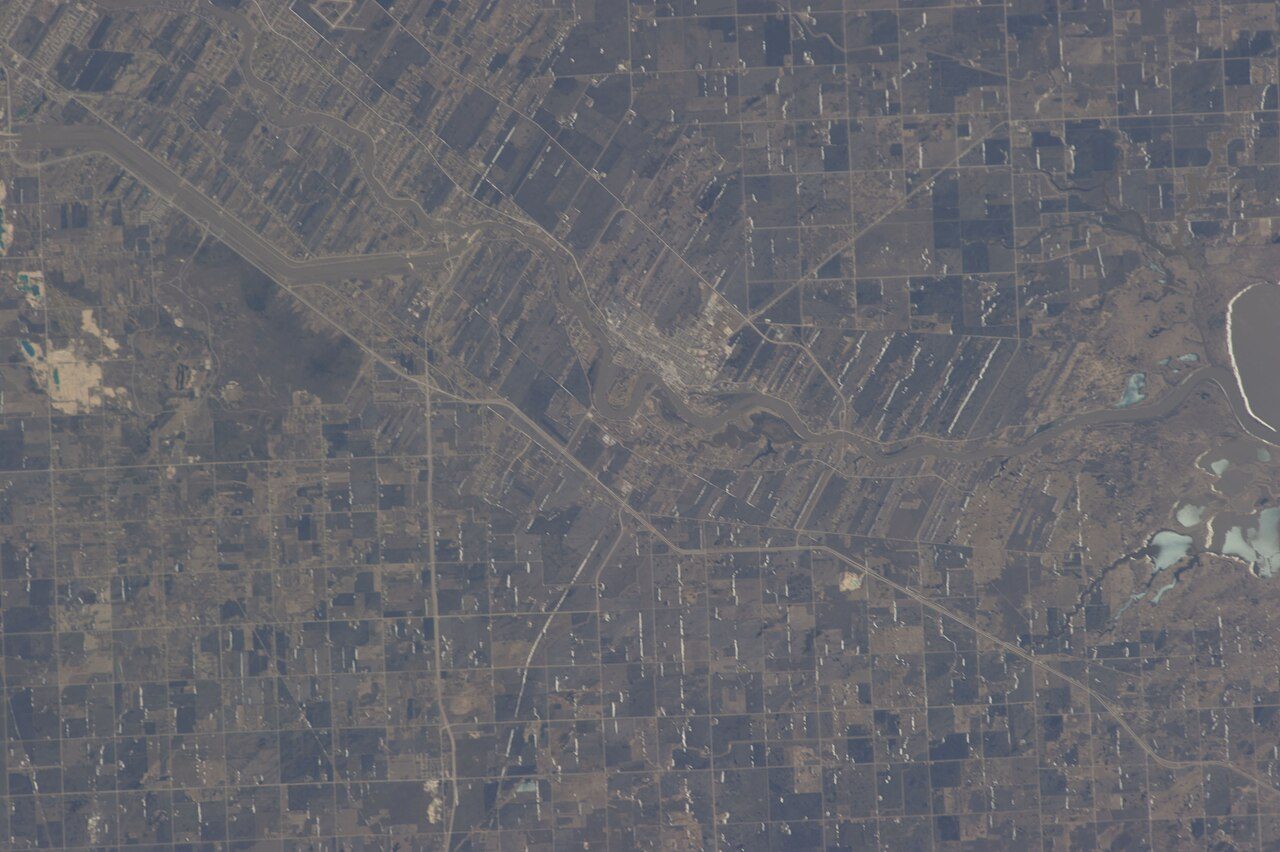
Division No. 1, UnorganizedManitoba
Population 1,445: a town in Manitoba. Its census division is Division No. 1.
Is Division No. 1, Unorganized a good place to live?
Health outcomes fall short of most towns (D). It is hard to get around without a car (D−). The typical owner put their home at $400,000 in 2021: 4.6 years of the median household’s income. Hazard risk is weaker too (D−).
Figures: home values and income: Statistics Canada, Census 2021. Division No. 1, Unorganized is graded subject by subject, but Canadian towns need 2,500 residents for an overall grade.
No Safety Grade: no police service publishes a crime rate for this place on its own. Crime here is counted against the people who live here, but many visitors or second-home owners add to it, so the rate per resident runs higher than residents' own risk. No School Grade: this province doesn't publish comparable results school by school. Health is graded on the health region's survey figures and life expectancy, with the distance to hospital giving the town its own spread. Wildfire lowers this town's Hazard risk Grade: a high share of the land around it has burned in the last 40 years.
What makes Division No. 1, Unorganized stand out
The 3 things Division No. 1, Unorganized does most differently from other towns.
How Division No. 1, Unorganized grades
Each subject compares Division No. 1, Unorganized with Canadian towns of 2,500 or more, ordered by how far it is from the middle. Towns in other countries are graded separately.
Division No. 1, Unorganized is graded subject by subject, but Canadian towns need 2,500 residents for an overall grade.
How TownRatings grades Canadian towns →
The data
Data highlights are ordered by what stands out in Division No. 1, Unorganized.
Hazard risk in Division No. 1, Unorganized is higher than in 96% of Canadian towns
Area-wide: radon tests, counted over the North Eastman health region
Earthquakes matter little: NRCan’s model puts building losses at $0.004 a year per $1,000 of value, against $0.030 for the typical town. With 0.36% of the land around it burning each year, Division No. 1, Unorganized sits in the high wildfire band (13% within 25 km since 1986). Radon is higher than usual: 21% of tested homes in the survey area topped the guideline, against 6.6% for the typical town.
Radon tests above the guideline · share of tested homes, 200 Bq/m³
| Hazards | Division No. 1, Unorganized | Manitoba | Canada |
|---|---|---|---|
| Radon tests above the guideline | 21% | 12% | 6.6% |
| Earthquake loss per $1,000 of buildings a year | $0.004 | $0.006 | $0.030 |
NRCan seismic risk model and burned areas, Health Canada radon survey, the Flood Hazard Map Inventory
For health, Division No. 1, Unorganized sits behind 95% of Canadian towns
Measured across the Interlake-Eastern Health Region: health survey and life expectancy
Closer to home, a hospital is 50 km from the average resident of Division No. 1, Unorganized, and 100% live more than 30 km away. At 17%, the share of adults who smoke tops the 12% for Manitoba. Lives here run to 78.5 years on average, below Manitoba’s towns (80.0) and Canadian towns (81.5) alike. On self-rated health the region tracks the province: 50% very good or excellent, 51% for Manitoba.
Very good or excellent health · adults, age-standardised
| Health | Division No. 1, Unorganized | Manitoba | Canada |
|---|---|---|---|
| Smokers | 17% | 10% | 12% |
| Chronic conditions (average share) | 20% | 18% | 17% |
| Life expectancy at birth | 78.5 | 80.0 | 81.5 |
| Very good or excellent health | 50% | 52% | 52% |
Statistics Canada, Canadian Community Health Survey 2023/2024 and life expectancy 2022/2024; Open Database of Healthcare Facilities
Older than 99% of Canadian towns: half of Division No. 1, Unorganized is over 62
First Nations, Métis and Inuit people make up 5.8% of residents, below Manitoba’s towns (12%) but above Canadian towns (2.8%). Immigrants make up 7% of residents, lower than Manitoba’s towns (7.7%) yet higher than Canadian towns (6.4%).
Ages · Share of residents in each age group, Census 2021
Schooling · Highest qualification, residents 15 and over
Women and men · all residents
48.2% of Division No. 1, Unorganized’s residents are women
Of the 2021 count, 665 were women and 715 men (women across Canada: 50.9%).
| Division No. 1, Unorganized | Manitoba | Canada | |
|---|---|---|---|
| Under 15 | 8.7% | 17% | 16% |
| 15 to 64 | 51% | 64% | 64% |
| 65+ | 40% | 17% | 19% |
| No certificate, diploma or degree | 11% | 16% | 16% |
| Postsecondary qualification | 51% | 52% | 56% |
Statistics Canada, Census 2021; Manitoba and Canada: medians of towns of 2,500+
Fewer of Division No. 1, Unorganized’s 15-to-64s are in work than in 97% of Canadian towns
91% of commuters drove, higher than Manitoba’s towns (87%) and near Canadian towns (89%). Workers spend 24 min getting to work, on average.
How working residents got to work · census 2021
| Census 2021 | Division No. 1, Unorganized | Manitoba | Canada |
|---|---|---|---|
| Car or van | 91% | 87% | 89% |
| Average trip | 24 min | 24 min | 26 min |
Statistics Canada, Census 2021 (labour and commuting) · These are May 2021 figures, gathered while COVID-19 kept many people home or out of work.
July afternoons in Division No. 1, Unorganized reach 25.1°C (Manitoba towns 25.8°C, Canadian towns 25.5°C)
Frost usually lifts by 24 May and returns around 19 September: 117 days without it. January nights in Division No. 1, Unorganized drop to −22.1°C on average. Frosty days number 198 in a normal year, close to Manitoba’s towns (193) and above Canadian towns (159). December is the snowiest month, with 29 cm on average.
Average high by season · ECCC normals, 1991–2020
| Normals, 1991–2020 | Division No. 1, Unorganized | Manitoba | Canada |
|---|---|---|---|
| January night low | −22.1°C | −21.2°C | −13.5°C |
| Days with frost a year | 198 | 193 | 159 |
| Precipitation a year | 643 mm | 519 mm | 883 mm |
| July afternoon high | 25.1°C | 25.8°C | 25.5°C |
Environment and Climate Change Canada, Canadian Climate Normals 1991–2020 (Indian Bay)
Division No. 1, Unorganized in November: highs near freezing, lows near −8°C
Hour-by-hour figures come from ECCC’s Whiteshell forecast, on the Weather page. Into December, the normals move to −7°C and −17°C. Expect about 36 mm of rain and snow over November.
Normal highs, the months ahead · ECCC normals, 1991–2020
| Season | High | Low | Rain and snow |
|---|---|---|---|
| Winter | −8°C | −20°C | 73 mm |
| Spring | 9°C | −4°C | 131 mm |
| Summer | 24°C | 12°C | 264 mm |
| Autumn | 10°C | 0°C | 175 mm |
ECCC normals, 1991–2020 (Indian Bay); the forecast is on the Weather page
Ted Falk won Provencher by 15,823 votes in 2021, a wider lead than in 80% of Canada’s ridings
Division No.
Wikidata, MAMH, MMAH, Statistics Canada
The nearest public library to Division No. 1, Unorganized is Pinawa Public Library, 50 km away
Visits and loans aren’t published as open data in Manitoba, so this page has none for Division No.
Provincial library statistics, OpenStreetMap, the CRA and Statistics Canada
Few places match Division No. 1, Unorganized for protected land nearby: more than 9 in 10 Canadian towns
13 protected areas lie within 10 km. The nearest national park is more than 100 km away. Within its own boundary, 25% of the town is protected. 17 mapped walking routes pass within 2 km, among them the North Whiteshell Trail and Mantario Trail.
Protected land · of the land within 10 km
| Outdoors | Division No. 1, Unorganized | Manitoba | Canada |
|---|---|---|---|
| Protected land within 10 km | 14% | 1.1% | 2.3% |
| Public protected areas within 10 km | 9 | 12 | 4 |
Canadian Protected and Conserved Areas Database (CPCAD), OpenStreetMap routes and beaches
Division No. 1, Unorganized is a town of owners: 93% of households own their home, above Manitoba’s towns and Canadian towns
6% of households spent 30% or more of their income on shelter, below Manitoba’s towns (15%) and Canadian towns (18%) alike.
What homes were worth · The median owner’s estimate at the 2021 census
| Census 2021 | Division No. 1, Unorganized | Manitoba | Canada |
|---|---|---|---|
| Households spending 30%+ on shelter | 6% | 15% | 18% |
| Households owning their home | 93% | 75% | 74% |
Statistics Canada, Census 2021; CMHC Rental Market Survey via Statistics Canada · These are 2021 census values, as owners judged them, set against household income in 2020.
West Hawk Museum and 3 more in and around Division No. 1, Unorganized
Sights in Division No. 1, Unorganized and close by, ordered by how widely each is known.
Everything we know about Division No. 1, Unorganized
Questions about Division No. 1, Unorganized
Has Division No. 1, Unorganized grown?
It added people: 1,023 in 2016, 1,380 in 2021, 34.9% more, where the middle of Canadian towns grew 4.1%. Statistics Canada’s 2025 estimate is 1,445.
Who are the people of Division No. 1, Unorganized?
0% of residents belong to a visible minority, against 15% for the median of Canadian towns; 6% have an Indigenous identity and 7% are immigrants.
What kind of homes are in Division No. 1, Unorganized?
98% of homes are single-detached houses, against 64% for the median of Canadian towns, and 0% are in apartment buildings of five storeys or more. A household averages 2.1 people; 25% are one person living alone.
Is Division No. 1, Unorganized a young town or an old one?
Half its people are older than 62 (the middle of Canadian towns: 45.2); children under 15 make up 9%, people 65 and over 40%.
About Division No. 1, Unorganized
Town in Manitoba
For Division No. 1, Unorganized, TownRatings uses Statistics Canada’s census-subdivision boundary in Manitoba, and every figure on its pages covers that whole area.
Statistics Canada: population estimates 2025 (17-10-0155), Census of Population 2021, 2021 census boundaries.
- Population
- 1,445 (people, 2025 estimate)
- Province or territory
- Manitoba
- Census division
- Division No. 1
- Census subdivision
- 4601094
Sources: Statistics Canada, Census of Population 2021 · population estimates 2025 (17-10-0155) and 2021 census boundaries · CMHC rents as published by Statistics Canada (34-10-0133) · grades by TownRatings. Under the Statistics Canada Open Licence.
Adapted from Statistics Canada (Census of Population 2021, population estimates 2025, 2021 census boundaries) under the Statistics Canada Open Licence; this does not constitute an endorsement by Statistics Canada. Neighbourhood names in some cities © OpenStreetMap contributors (ODbL).