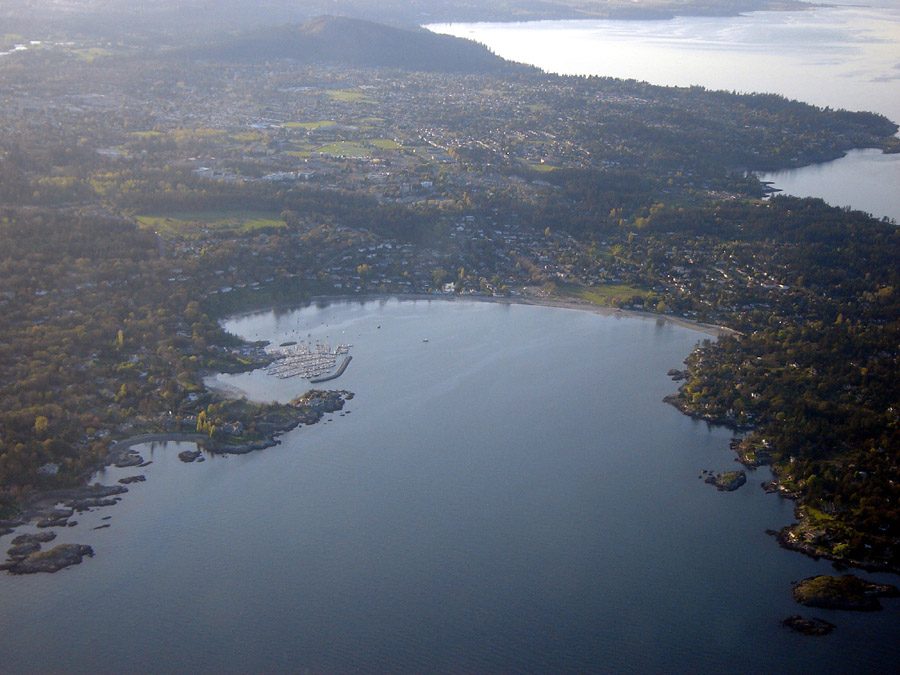
 Photo: Keefer4~commonswiki · CC BY-SA 2.5
New building in Saanich runs at 7.5 homes a year per 1,000, well under 18.1 for British Columbia’s towns
Census values for 2021: a median of $930,000 and an average of $1,011,000. The census asks owners what their home would sell for, so the values are estimates from May 2021. Sales are published too: 2,170 buyers in 2023, at a median $1,030,000.
What Saanich’s homes are worth, three ways
Each source sits beside its own median for British Columbia’s towns; none compares across provinces, which value homes in their own ways.
median, owners’ estimate
- Average
- $1.01M
- Owners
- 33,140
- British Columbia’s towns
- $720K
- The typical Canadian town
- $406K
median sale price
- Average sale
- $1.09M
- ÷ buyers’ income
- 5.6×
- Buyers
- 2,170
- British Columbia’s towns
- $682K
all residential
- British Columbia’s towns
- $671K
Census 2021 (Statistics Canada); Canadian Housing Statistics Program, tables 46-10-0099 and 46-10-0093; Québec rôle d’évaluation foncière 2026 (MAMH).
Saanich’s detached houses are assessed 54% above the median of British Columbia’s towns
Of Saanich’s 38,515 residential properties on the 2024 roll, 55% are detached houses and 15% are condos.
Median assessment by type, 2024 the tick is the median of British Columbia’s towns
Canadian Housing Statistics Program, table 46-10-0093 (2024): residential properties on the assessment roll, vacant land left out. The ticks are the median of British Columbia’s towns with their own figure; assessments compare within a province only.
The homes of Saanich, by period and type
The 2021 census counted 48,045 occupied homes in Saanich; 47% of them are single-detached houses. The older half dates from before 1981.
Homes by period of construction the tick is the median of British Columbia’s towns
Homes by kind
| Saanich | British Columbia | Canada | |
|---|---|---|---|
| Condominiums | 16% | 10% | 8% |
| Needing major repairs | 5% | 6% | 6% |
| Too small for the household | 4% | 4% | 3% |
| Households in core housing need | 10% | 10% | 7% |
Census 2021 (Statistics Canada): occupied private dwellings; core housing need as Statistics Canada defines it. Ticks and columns are medians of the towns and neighbourhoods of 2,500 or more.
Saanich’s busiest year for permits was 2023, with 629 new homes
Over 2018–2023, 2,419 homes were permitted in Saanich, close to 403 each year. Multi-unit buildings took most: single-unit ones were just 11%, where British Columbia’s towns built 27%.
New homes a year per 1,000 homes
Down 5%: 4,220 new homes in the year to August 2026
Source area for monthly permits: the Victoria metro area
Statistics Canada, tables 46-10-0087 (building permits by census subdivision, 2018–2023: dwelling units created, new construction and conversions) and 34-10-0292 (monthly, metro areas). Per 1,000: units a year over 2019–2023 against occupied homes in 2021.
Saanich is 29% above the $720,000 median of British Columbia’s towns
254 of British Columbia’s towns (2,500 people or more), by median value at the 2021 census, dearest first.
Census 2021, owners’ estimates; towns and neighbourhoods of 2,500 or more, no city as a whole, no reserve.
Lower values near Saanich: Victoria, Esquimalt and View Royal
Next to Saanich: 2021 census values and the share of owners.
| Town | Median home value | Average | Owners | km |
|---|---|---|---|---|
| Saanich | $930K | $1.01M | 69% | |
| Victoria | $750K | $821K | 40% | 5.1 |
| New Songhees 1A | – | – | 65% | 5.3 |
| Esquimalt | $750K | $776K | 49% | 5.5 |
| Oak Bay | $1.4M | $1.64M | 75% | 6.3 |
| View Royal | $800K | $848K | 67% | 6.3 |
| Colwood | $800K | $823K | 74% | 11 |
Census 2021 values; km.
Questions about property prices in Saanich
Is Saanich expensive for British Columbia?
On census values, Saanich ranks among the dearer of British Columbia’s towns (median $720,000).
What is the average house price in Saanich?
The average sale was $1,090,000 in 2023, and at the median, buyers paid 5.6 times their income.
How many households in Saanich are in core housing need?
10% of Saanich’s households, near the 10% of British Columbia’s towns, live in a home that is unaffordable, crowded or in poor repair and can’t afford a better one nearby.
Can I see individual sales or prices by street?
No. Canada has no open register of individual sales; Statistics Canada publishes medians and averages by town only.
Sources: Statistics Canada, Census of Population 2021 · Statistics Canada, Canadian Housing Statistics Program · Statistics Canada, building permits (tables 46-10-0087 and 34-10-0292). Under the Statistics Canada Open Licence.
Adapted from Statistics Canada (Census of Population 2021, population estimates 2025, 2021 census boundaries) under the Statistics Canada Open Licence; this does not constitute an endorsement by Statistics Canada. Neighbourhood names in some cities © OpenStreetMap contributors (ODbL).