
Capilano 5British Columbia
This First Nations reserve in British Columbia has a population of 3,376. It is part of the Vancouver metro area.
Is Capilano 5 a good place to live?
School results are strong (A). Incomes are on the low side (D−). It also trails on hazard risk (C+).
Reserves such as Capilano 5 stay out of the grades and the ranked lists. Statistics Canada publishes too little of their data, and what it does publish can’t be weighed fairly against other towns.
Rents here are the metro area's average, shared by every town and neighbourhood in it. No Safety Grade: no police service publishes a crime rate for this place on its own. Health is graded on the health region's survey figures and life expectancy, with the distance to hospital giving the town its own spread. A First Nations reserve: subject grades only, with no overall grade and no place in ranked lists.
How Capilano 5 grades
Each subject compares Capilano 5 with Canadian towns of 2,500 or more, ordered by how far it is from the middle. Towns in other countries are graded separately.
Reserves such as Capilano 5 stay out of the grades and the ranked lists. Statistics Canada publishes too little of their data, and what it does publish can’t be weighed fairly against other towns.
How TownRatings grades Canadian towns →
What makes Capilano 5 stand out
The 3 things Capilano 5 does most differently from other towns.
The data
Data highlights are ordered by what stands out in Capilano 5.
Capilano 5 scores better for health than almost every Canadian town
Adults here are more upbeat about their health than the province: 59% very good or excellent, against 50% in British Columbia. On average 12% of adults live with arthritis, diabetes or high blood pressure, below British Columbia’s towns (15%) and Canadian towns (17%) alike. Life expectancy in the region is 84.3 years (86.3 for women, 82.3 for men, 2022/2024). Smoking is rarer than in the province: 6.5% of adults, against 8.9% for British Columbia. Capilano 5 doesn’t get its own health survey and life expectancy figures; the ones here come from the North Shore/Coast Garibaldi Health Service Delivery Area.
Very good or excellent health · adults, age-standardised
| Health | Capilano 5 | British Columbia | Canada |
|---|---|---|---|
| Very good or excellent health | 59% | 50% | 52% |
| Chronic conditions (average share) | 12% | 15% | 17% |
| Life expectancy at birth | 84.3 | 81.0 | 81.5 |
| Smokers | 6.5% | 9% | 12% |
Statistics Canada, Canadian Community Health Survey 2023/2024 and life expectancy 2022/2024; Open Database of Healthcare Facilities
Households in Capilano 5 have lower incomes than those in 92% of Canadian towns
Commutes averaged 27 min, about level with both British Columbia’s towns (26 min) and Canadian towns (26 min).
How working residents got to work · census 2021
| Census 2021 | Capilano 5 | British Columbia | Canada |
|---|---|---|---|
| Average trip | 27 min | 26 min | 26 min |
Statistics Canada, Census 2021 (labour and commuting) · Census day was in May 2021, mid-pandemic, so commuting and work figures carry the lockdowns’ mark.
10 of Capilano 5’s 21 tested schools score in the top fifth in British Columbia
3 boards run its schools. Taken together, Capilano 5 and its 3 km edge hold 18 elementary schools, 4 secondary schools and 1 alternative or adult school. The nearest secondary school is 2.5 km away, higher than both British Columbia’s towns (1.8 km) and Canadian towns (1.2 km).
| School | Level | Students | System |
|---|---|---|---|
| St. Anthony's IndependentNearest elementary school, 0.5 kmElementary | Elementary | – | Independent |
| Bodwell High School IndependentNearest secondary school, 1.5 kmSecondary | Secondary | – | Independent |
| Chartwell Elementary Top fifth in British ColumbiaResults in the top fifth in British ColumbiaElementary | Elementary | – | English public |
Schools by system · Schools within 3 km
| Schools within 3 km | Capilano 5 | British Columbia | Canada |
|---|---|---|---|
| School boards | 3 | 2 | 3 |
| Nearest secondary school | 2.5 km | 1.8 km | 1.2 km |
Provincial school lists and results, 2025/26
Winters are mild in Capilano 5: January nights hold at 3.3°C, above British Columbia’s towns and Canadian towns
For the wettest month, look to November: 245 mm on average. There are 17 days of frost in a typical year, below British Columbia’s towns (60) and Canadian towns (159) alike. In July, daytime highs in Capilano 5 average 23.0°C. December is the snowiest month, with 14 cm on average.
Average high by season · ECCC normals, 1991–2020
| Normals, 1991–2020 | Capilano 5 | British Columbia | Canada |
|---|---|---|---|
| Days with frost a year | 17 | 60 | 159 |
| January night low | 3.3°C | 0.5°C | −13.5°C |
| Precipitation a year | 1,537 mm | 1,152 mm | 883 mm |
| Snowfall a year | 37 cm | 51 cm | 141 cm |
Environment and Climate Change Canada, Canadian Climate Normals 1991–2020 (Vancouver (Harbour))
Shaking costs buildings in Capilano 5 $0.64 a year per $1,000 of value, 21 times the typical town’s
One flood study covers the town, by City of Vancouver. Fewer homes than usual carry radon here, 2.5% over the guideline where the typical town has 6.6%. Burn scars are few around Capilano 5, with 0.2% of the land within 25 km touched by fire since 1986 (0.004% a year).
Radon tests above the guideline · share of tested homes, 200 Bq/m³
| Hazards | Capilano 5 | British Columbia | Canada |
|---|---|---|---|
| Earthquake loss per $1,000 of buildings a year | $0.64 | $0.36 | $0.030 |
| Radon tests above the guideline | 2.5% | 1.8% | 6.6% |
NRCan seismic risk model and burned areas, Health Canada radon survey, the Flood Hazard Map Inventory · Area behind the radon tests figures: the North Shore/Coast Garibaldi health region
Expect November days around 10°C in Capilano 5, nights around 5°C
Expect around 3 cm of snow in November. Next comes December, with normal highs of 7°C and lows of 3°C. Rain and snow over a typical November come to 245 mm. The forecast on the Weather page is ECCC’s for West Vancouver.
Normal highs, the months ahead · ECCC normals, 1991–2020
| Season | High | Low | Rain and snow |
|---|---|---|---|
| Winter | 8°C | 3°C | 554 mm |
| Spring | 14°C | 7°C | 353 mm |
| Summer | 22°C | 14°C | 158 mm |
| Autumn | 14°C | 9°C | 473 mm |
ECCC normals, 1991–2020 (Vancouver (Harbour)); the forecast is on the Weather page
North Vancouver—Capilano, which takes in Capilano 5, is held by Jonathan Wilkinson (Liberal Party of Canada)
For the Legislative Assembly of British Columbia, Capilano 5 spreads over 2 ridings: North Vancouver-Lonsdale and West Vancouver-Capilano.
Wikidata, MAMH, MMAH, Statistics Canada
No public library stands in Capilano 5: the closest, West Vancouver Memorial Library, is 2.4 km away
After it comes NVDPL: Capilano Branch (North Vancouver), 2.8 km away.
Provincial library statistics, OpenStreetMap, the CRA and Statistics Canada
The The Trans Canada Trail passes Capilano 5
Within 10 km, 8.4% of the land is protected, above British Columbia’s towns (6.7%) and Canadian towns (2.3%) alike. Swimmers have 69 beaches within 5 km, Ambleside Beach the nearest. A drive of 50 km reaches Gulf Islands National Park Reserve, the nearest national park.
Protected land · of the land within 10 km
| Outdoors | Capilano 5 | British Columbia | Canada |
|---|---|---|---|
| Protected land within 10 km | 8.4% | 6.7% | 2.3% |
| Public protected areas within 10 km | 7 | 14 | 4 |
Canadian Protected and Conserved Areas Database (CPCAD), OpenStreetMap routes and beaches
More of Capilano 5’s residents have an Indigenous identity than in British Columbia’s towns or Canadian towns: 36%
Children under 15 make up 10%, lower than both British Columbia’s towns (14%) and Canadian towns (16%). People 65 and over make up 22% of the town.
Ages · Share of residents in each age group, Census 2021
Schooling · Highest qualification, residents 15 and over
Women and men · all residents
Women make up 51.9% of Capilano 5
1,505 women and 1,395 men at the 2021 census; across Canada, women are 50.9%.
| Capilano 5 | British Columbia | Canada | |
|---|---|---|---|
| Under 15 | 10% | 14% | 16% |
| 15 to 64 | 68% | 64% | 64% |
| 65+ | 22% | 21% | 19% |
| No certificate, diploma or degree | 13% | 13% | 16% |
| Postsecondary qualification | 60% | 56% | 56% |
Statistics Canada, Census 2021; British Columbia and Canada: medians of towns of 2,500+
Everything we know about Capilano 5
Stanley Park and 72 more in and around Capilano 5
From museums to parks and historic sites: Capilano 5’s places to visit and those just beyond its edge, most famous first.
 GardenStanley Park1.7 km outside town, to the southwest
 MuseumMuseum of Vancouver4.2 km outside town, to the southwest · 78K visitors a year
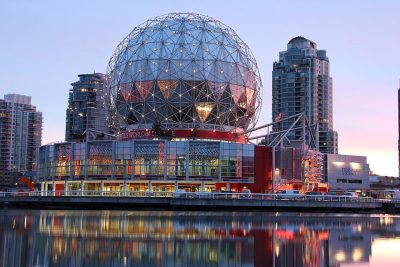 Big drawMuseumScience World4.7 km outside town, to the south · 650K visitors a year
 AquariumVancouver Aquarium1.4 km outside town, to the southwest
 CathedralCathedral of Our Lady of the Rosary, Vancouver3.5 km outside town, to the south
 GardenDr. Sun Yat-Sen Classical Chinese Garden4 km outside town, to the south
Photos: each place’s Wikidata image, from Wikimedia Commons under the licence below (our copy, resized).
Photo credits (6)
- Stanley Park: squeakymarmot, CC BY 2.0, Wikimedia Commons
- Museum of Vancouver: Bobanny, Public domain, Wikimedia Commons
- Science World: Differense, CC BY-SA 3.0, Wikimedia Commons
- Vancouver Aquarium: Emancipator at en.wikipedia, CC BY-SA 3.0, Wikimedia Commons
- Cathedral of Our Lady of the Rosary, Vancouver: Bobanny, Public domain, Wikimedia Commons
- Dr. Sun Yat-Sen Classical Chinese Garden: Bobanny, Public domain, Wikimedia Commons
Famous people from around Capilano 5
No notable person born in Capilano 5 is on our list; these were born in the towns around it.


Photo credits
Serinda Swan: AMFM STUDIOS LLC, CC BY 3.0 · Marielle Thompson: Robert Thivierge, CC BY-SA 3.0 · Leah Cairns: vagueonthehow from Tadcaster, York, England, CC BY 2.0 · Britt Janyk: Christian Jansky, CC BY-SA 3.0
About Capilano 5
First Nations reserve in British Columbia
Statistics Canada counts Capilano 5, a First Nations reserve in British Columbia, as its own census subdivision.
Statistics Canada: population estimates 2025 (17-10-0155), Census of Population 2021, 2021 census boundaries.
- Population
- 3,376 (people, 2025 estimate)
- Province or territory
- British Columbia
- Census division
- Greater Vancouver
- Metro area
- Vancouver
- First Nation
- Squamish
- The community’s own name
- Sḵwx̱wú7mesh Úxwumixw
- Census subdivision
- 5915808
Capilano 5’s neighbours
The nearest places of 1,000 or more. Statistics Canada
| Town | People | km | Overall | Cost | Safety | Health |
|---|---|---|---|---|---|---|
| Capilano 5 | 3,376 | — | — | — | — | A+ |
| Coal Harbour | 10,407 | 3.8 | B− | D− | C− | A+ |
| West End | 30,785 | 3.9 | B− | D− | C− | A+ |
| West Vancouver | 47,929 | 4 | B+ | D− | B | A+ |
| North Vancouver | 66,624 | 4.4 | B+ | D− | C | A+ |
| Davie Village | 16,833 | 4.5 | C+ | D− | C− | A+ |
| Granville Entertainment District | 19,125 | 5.1 | B− | D− | C− | A+ |
People: Statistics Canada, Census 2021. Distances: centre to centre.
Questions about Capilano 5
What kind of homes are in Capilano 5?
23% of homes are single-detached houses, against 64% for the median of Canadian towns, and 64% are in apartment buildings of five storeys or more. A household averages 2.2 people; 40% are one person living alone.
Is Capilano 5 growing?
It went from 2,931 people in 2016 to 2,899 in 2021, down 1.1%, while the median of Canadian towns grew 4.1%. StatCan’s 2025 estimate is 3,376.
How old are the people of Capilano 5?
Its median age is 45.6, where Canadian towns sit at 45.2.
Sources: Statistics Canada, Census of Population 2021 · population estimates 2025 (17-10-0155) and 2021 census boundaries · CMHC rents as published by Statistics Canada (34-10-0133) · grades by TownRatings. Under the Statistics Canada Open Licence.
Adapted from Statistics Canada (Census of Population 2021, population estimates 2025, 2021 census boundaries) under the Statistics Canada Open Licence; this does not constitute an endorsement by Statistics Canada. Neighbourhood names in some cities © OpenStreetMap contributors (ODbL).