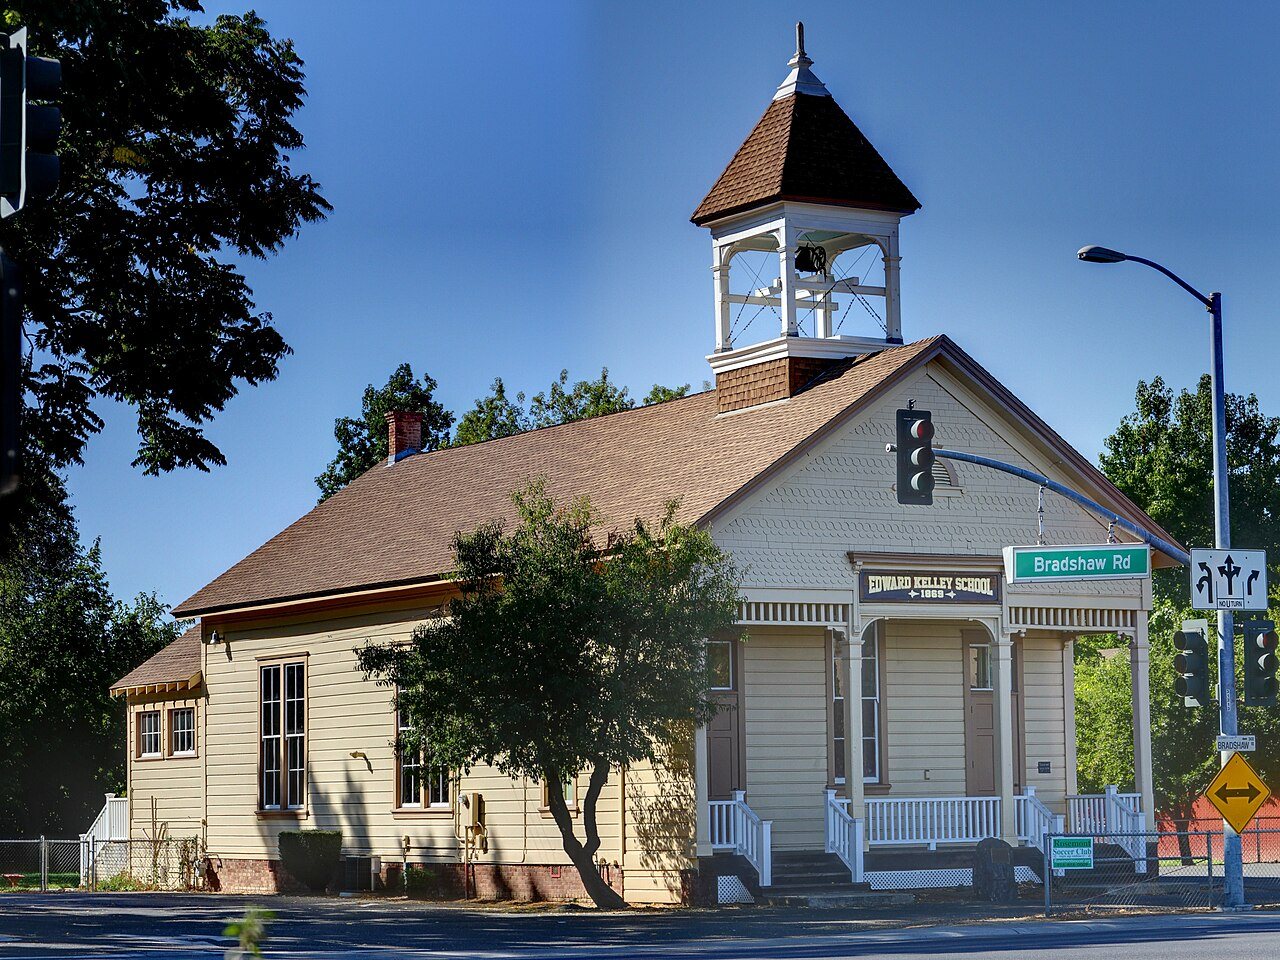
Rosemont’s lowest grade is for cost of living: the typical home is worth about $454K, 4.7 years of the Sacramento metro’s $97K median household income. This California town grades B− overall and ranks 231st of 841 in California. Nationally, it does better than 47% of U.S. towns. Walkability is its strong suit — it is easier to get around on foot or by transit than 92% of U.S. towns. The town is home to Carrington College-Sacramento. Its July high is 94°F, above both California’s towns (89°F) and U.S. towns (85°F). On hazard risk, just 7 of California’s 1,064 towns do better. Brighton School is on the National Register of Historic Places.
Figures: home values, Zillow · incomes, Census ACS, 2020–24 · FEMA National Risk Index · NOAA normals, 1991–2020 · National Register of Historic Places.
Rosemont carries less natural-hazard risk than nearly all of California (mostly inland flooding), has hotter summers than nearly all U.S. towns and has home values still below their peak.
The typical value, about $455K, is 8% below its July 2022 peak.
On the market in Rosemont: a median 22 days to sell. 62% of Rosemont households live in a home they own. The midpoint rent for Rosemont comes to $1,831 a month.
Its public schools are run by the Sacramento City Unified school district. Two of its 7 schools are below, each with the reason it’s listed. The largest public high school is Rosemont High, with 1,485 students.
There are 4.4 miles of trail across 5 parks and preserves. The biggest park or preserve is Rosemont Community Park, at 27 acres. Its density of trails is 1.0 miles per square mile.
Among workers in Rosemont, 18% work from home. Only 3% of working residents stay in Rosemont for work; the rest commute out. Also worth knowing: since 2013, Rosemont has added 2,348 jobs, to 7,404 in 2023. The top destinations are Sacramento (32%), Rancho Cordova (7%) and Arden-Arcade (4%).
3%work in town
Rosemont
California towns
U.S. towns
Below the poverty line
17%
10%
9.6%
Work from home
18%
14%
11%
Working residents who work in town
2.7%
6.6%
8%
Average trip to work
28 minutes
28 minutes
25 minutes
Where working residents work
In Rosemont3%
Sacramento32%
Rancho Cordova7%
Arden-Arcade4%
Roseville3%
8 mi
median commute distance
7,404
jobs based in Rosemont
A commuter town
jobs vs. working residents
A
Walkability grade: more walkable than 92% of U.S. towns
FEMA rates its natural-hazard risk lower than 99% of California towns, with expected losses of about $137 per resident a year; that rating is what its A− for hazard risk is built on.
Of the losses FEMA expects in Rosemont, 64% come from inland flooding and 31% from earthquakes. 20 flood insurance claims have been paid in the town since 1986.
In Rosemont, 30% of adults have obesity. Of 32 CDC measures, Rosemont beats the California average on 3 and trails it on 3. Two figures for adults locally: 39% feel lonely, 20% get no exercise outside work.
By age, Rosemont looks like California: each broad group is within 4 points. For Rosemont, the median age is 35.6 years. California has 37% of adults 25 and older with a bachelor’s degree or more; here it is 29%.
35.6median age · CA 37.9
Rosemont
California towns
U.S. towns
Median age
35.6 years
39.1 years
40.5 years
Aged 65 or older
16%
16%
18%
Under 18
23%
22%
22%
RosemontCaliforniaUnited States
Ages · share of residents
19%
<1010–1718–2425–3435–4445–5455–6465–7475+
Education · adults 25 and older
No diploma7%
High school24%
Some college24%
Associate’s16%
Bachelor’s20%
Graduate9%
Women and men · all residents
52% women, 48% men
WomenCAU.S.Men
That’s an even split within the survey’s margin of ±2.6 points. Across California, 50.1% of residents are women. Median age: women 37.5, men 34.6.
Where Rosemont’s working residents go each day. Line width shows the share.
7,404jobs based in Rosemont
3%of working residents work in town
8 mimedian commute distance
Census LEHD 2023
About Rosemont
Census-designated place in California, United States
Rosemont is a census-designated place (CDP) in Sacramento County, California, United States. It is part of the Sacramento–Arden-Arcade–Roseville metropolitan area. The population rose to 23,510 at the 2020 census. It was 22,681 at the 2010 census, down from 22,904 at the 2000 census.
Rosemont grades B− overall, better than 47% of U.S. towns and #231 of 841 in California. It grades B+ for health and B− for schools. Cost of living is its weak spot, with a C−.
Is Rosemont, CA expensive?
Yes. Cost of living, which also weighs rents, property taxes and how many households pay 30% or more of their income for housing, grades C−.
 6 mi
 4 mi
 11 mi
 7 mi
 8 mi
 8 mi


