
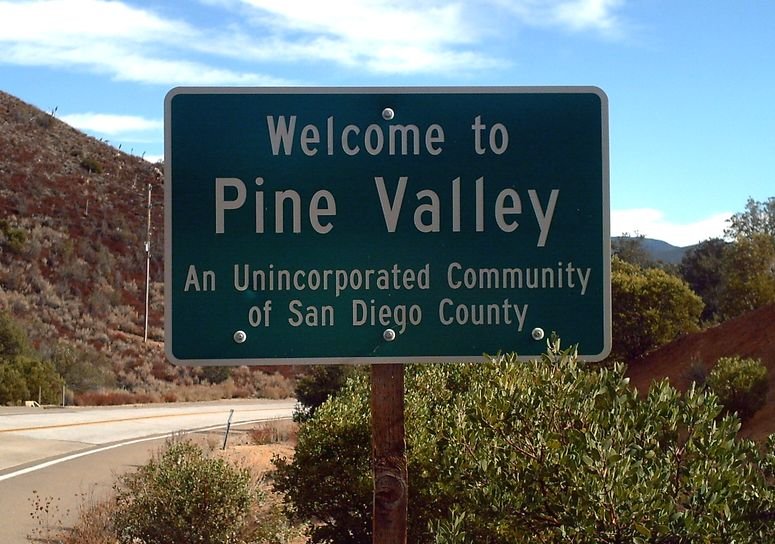
Pine Valley Sign, 2006
Pine Valley’s story
102 years in pictures
The archive holds 4 old photos and papers going back to 2006.
- 1924Pine Valley is settled
Each edition grades its towns against each other only.
A town of 1,786, settled in 1924.
Pine Valley’s best subject grades are an A− for incomes and the outdoors; its weakest is a D− for hazard risk. Pine Valley’s average trip to work is 42 minutes, where California’s towns sit at 28 minutes and U.S. towns at 25 minutes. Only 5 of California’s 1,064 towns score lower on hazard risk. Most errands need a car: it is less walkable than 80% of U.S. towns. 80% of the land in Pine Valley is conserved, where California’s towns sit at 4.3% and U.S. towns at 4.3%. The biggest place to walk is Cleveland National Forest, 3,532 acres with 8.9 miles of trail. Pine Valley has fewer than 2,500 residents, so it gets subject grades but no overall grade.
Where Pine Valley beats most towns, and one thing worth knowing.
Where Pine Valley’s working residents go each day. Line width shows the share.
Census LEHD 2023
Each subject compared with towns across the country (schools within California), ordered by how far Pine Valley is from typical.
How TownRatings grades towns →
The archive holds 4 old photos and papers going back to 2006.
Pine Valley is unincorporated, so San Diego County and regional agencies provide most services.
EPA SDWIS (Oct 9, 2026) · HIFLD + EIA-861 2025 · Census 2020 ZCTAs · NCES 2024–25 · registration: vote.gov, updated Nov 18, 2024.
Ordered by what stands out in Pine Valley.
9.0 miles of trail in 2 parks and preserves. Pine Valley’s trail density is 1.3 miles per square mile.
| Biggest places to walk | Trails | Acres |
|---|---|---|
| 1. Cleveland National Forest | 8.9 mi | 3,532 |
| 2. Pine Valley County Park | — | 18 |
Trails & parks © OpenStreetMap contributors · Conserved land: USGS PAD-US
Its public schools are run by the JCS - Pine Valley District. One of its 3 schools is below, with why it’s listed.
| School | Level | Students | Letter |
|---|---|---|---|
| JCS - Pine ValleyLargest public high schoolGrades K–12 | Grades K–12 | 184 | B− |
NCES · EDFacts · graded within CA on state tests and graduation
The FEMA risk score in Pine Valley is 100 of 100.
FEMA National Risk Index · OpenFEMA
Adults 35 to 64 are 25% of residents (39% statewide); people 65 and older are 28% of residents (16% statewide). 28% of adults 25 and older have a bachelor’s degree or more, vs 37% across California.
| Pine Valley | California towns | U.S. towns | |
|---|---|---|---|
| Aged 65 or older | 28% | 16% | 18% |
| Median age | 42.8 years | 39 years | 40.5 years |
46% women, 54% men
That’s an even split within the survey’s margin of ±6.8 points. Across California, 50.1% of residents are women.
| Pine Valley | CA | U.S. | |
|---|---|---|---|
| Under 10 | 10.7% | 11.4% | 11.6% |
| 10 to 17 | 9.5% | 10.5% | 10.3% |
| 18 to 24 | 8.8% | 9.1% | 9.1% |
| 25 to 34 | 18.3% | 14.8% | 13.7% |
| 35 to 44 | 4.9% | 13.9% | 13.2% |
| 45 to 54 | 9.2% | 12.5% | 12.2% |
| 55 to 64 | 10.7% | 12.1% | 12.7% |
| 65 to 74 | 19.8% | 9.2% | 10.2% |
| 75 and older | 8.1% | 6.5% | 7% |
| No diploma | 4.4% | 15.3% | 10.4% |
| High school | 23.3% | 20.5% | 26% |
| Some college | 37.1% | 19.3% | 19.1% |
| Associate’s | 7.6% | 7.9% | 8.8% |
| Bachelor’s | 11.7% | 22.7% | 21.6% |
| Graduate | 15.8% | 14.4% | 14.1% |
U.S. Census Bureau · ACS 2020-2024 5-year estimates · in a town of 1,800, single groups can be off by several points
2.9% of residents live below the poverty line in Pine Valley. Most working residents leave Pine Valley for work: only 2% work in town. The top destinations are San Diego (29%), El Cajon (6%) and Alpine (5%).
| Pine Valley | California towns | U.S. towns | |
|---|---|---|---|
| Median household income | $133,000 | $95,000 | $80,000 |
| Below the poverty line | 2.9% | 10% | 9.6% |
| Working residents who work in town | 1.8% | 6.6% | 8% |
Census LEHD 2023 · ACS
Pine Valley beats the California average on 12 of 32 CDC measures and trails it on 7. 27% of Pine Valley adults have obesity.
| Pine Valley | California towns | U.S. towns | |
|---|---|---|---|
| Obesity (CDC PLACES) | 27% | 29% | 35% |
| Get no exercise (CDC PLACES) | 20% | 24% | 25% |
| Yearly checkup (CDC PLACES) | 76% | 72% | 79% |
| Sleep under 7 hours (CDC PLACES) | 33% | 35% | 36% |
| What stands out | Pine Valley | CA |
|---|---|---|
| Fewer uninsured adults | 6% | 10.6% |
| Fewer adults facing food insecurity | 11% | 17.9% |
| More adults who have had cancer | 10.5% | 6.4% |
CDC PLACES 2025 · modeled estimates for adults · CMS · HRSA
Pine Valley has mild winters and warm summers, with very little rain. July afternoons reach 89° and January nights drop to 35°.
NOAA U.S. Climate Normals, 1991–2020
Zillow Home Value Index · Redfin Data Center
None within 15 miles of Pine Valley; the nearest are
About 10 of every 100 Pine Valley residents are enrolled in college, against 8 across California.
Census-designated place in California, United States
Pine Valley is a community and census-designated place (CDP) in the Cuyamaca Mountains of the Mountain Empire area, in southeastern San Diego County, California. The population was 1,645 at the 2020 census, up from 1,510 at the 2010 census.
From Wikipedia, licensed CC BY-SA 4.0 · facts via Wikidata (CC0)
Short answers, built from the data on this page.
The typical home is worth about $628,000, 18% below the California typical home. Cost of living, which also weighs rents, property taxes and how many households pay 30% or more of their income for housing, grades C.