

Griffith Quarry · National Register of Historic Places
Penryn’s story
153 years in pictures
The archive holds 3 old photos and papers going back to 2013.
2 places on the National Register of Historic Places.
- 1873Penryn is settled
Each edition grades its towns against each other only.
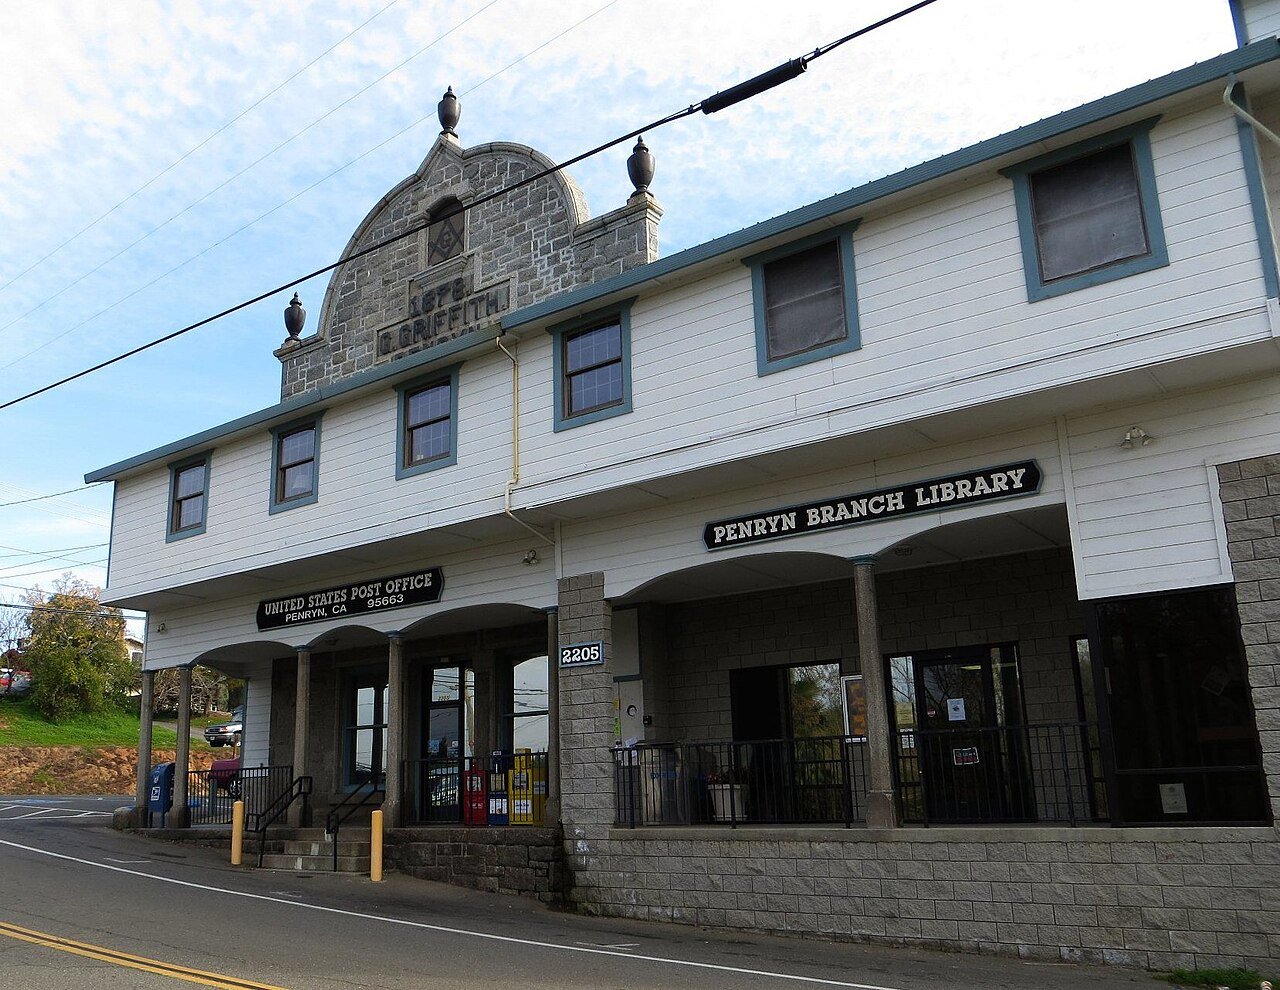
Public schools that outperform most of California.
The best of Penryn’s subject grades are an A+ for incomes, an A for schools, and an A− for health. Penryn’s median age is 56 years, above both California’s towns (39 years) and U.S. towns (40.5 years). On incomes, just 16 of California’s 1,056 towns do better. On history, just 55 of California’s 1,063 towns do better. The biggest park or preserve is Griffith Quarry Historic Park, at 25 acres. Penryn has fewer than 2,500 residents, so it gets subject grades but no overall grade.
Where Penryn beats most towns.
In a town this size, neighbors are the best guide. Ask them anything.
Each subject compared with towns across the country (schools within California), ordered by how far Penryn is from typical.
How TownRatings grades towns →
The archive holds 3 old photos and papers going back to 2013.
2 places on the National Register of Historic Places.
Penryn is unincorporated, so Placer County and regional agencies provide most services.
EPA SDWIS (Oct 9, 2026) · HIFLD + EIA-861 2025 · Census 2020 ZCTAs · NCES 2024–25 · registration: vote.gov, updated Nov 18, 2024.
Ordered by what stands out in Penryn.
Its public schools are run by the Loomis Union Elementary school district. One of its 2 schools is below, with why it’s listed.
| School | Level | Students | Letter |
|---|---|---|---|
| Penryn ElementaryLargest public elementary schoolGrades K–8 | Grades K–8 | 250 | – |
NCES · EDFacts · graded within CA on state tests and graduation
Penryn beats the California average on 13 of 32 CDC measures and trails it on 3. 31% of Penryn adults feel lonely, where California’s towns sit at 36% and U.S. towns at 33%. 19% of adults get no exercise outside work in Penryn.
| Penryn | California towns | U.S. towns | |
|---|---|---|---|
| Feel lonely (CDC PLACES) | 31% | 36% | 33% |
| Get no exercise (CDC PLACES) | 19% | 24% | 25% |
| Sleep under 7 hours (CDC PLACES) | 32% | 35% | 36% |
| Food insecurity (CDC PLACES) | 9.2% | 16% | 14% |
| What stands out | Penryn | CA |
|---|---|---|
| Fewer uninsured adults | 4.9% | 10.6% |
| Fewer adults facing food insecurity | 9.2% | 17.9% |
| More adults who have had cancer | 9.9% | 6.4% |
CDC PLACES 2025 · modeled estimates for adults · CMS · HRSA
Adults 18 to 34 are 7% of residents (24% statewide); people 65 and older are 29% of residents (16% statewide). 38% of Penryn adults 25 and older hold a bachelor’s degree or more.
| Penryn | California towns | U.S. towns | |
|---|---|---|---|
| Bachelor’s degree or more, 25+ | 38% | 29% | 29% |
| Under 18 | 22% | 22% | 22% |
53% women, 47% men
That’s an even split within the survey’s margin of ±5 points. Across California, 50.1% of residents are women.
| Penryn | CA | U.S. | |
|---|---|---|---|
| Under 10 | 8.6% | 11.4% | 11.6% |
| 10 to 17 | 13.2% | 10.5% | 10.3% |
| 18 to 24 | 3.4% | 9.1% | 9.1% |
| 25 to 34 | 3.1% | 14.8% | 13.7% |
| 35 to 44 | 14% | 13.9% | 13.2% |
| 45 to 54 | 6.9% | 12.5% | 12.2% |
| 55 to 64 | 22% | 12.1% | 12.7% |
| 65 to 74 | 13% | 9.2% | 10.2% |
| 75 and older | 15.8% | 6.5% | 7% |
| No diploma | 6.7% | 15.3% | 10.4% |
| High school | 7.1% | 20.5% | 26% |
| Some college | 29.7% | 19.3% | 19.1% |
| Associate’s | 18.5% | 7.9% | 8.8% |
| Bachelor’s | 17.8% | 22.7% | 21.6% |
| Graduate | 20.3% | 14.4% | 14.1% |
U.S. Census Bureau · ACS 2020-2024 5-year estimates · in a town of 1,100, single groups can be off by several points
Penryn’s median household income is $127,000. Jobs based in Penryn grew to 381 in 2023, 161 more than in 2013. Penryn’s average trip to work is 23 minutes.
| Penryn | California towns | U.S. towns | |
|---|---|---|---|
| Median household income | $127,000 | $95,000 | $80,000 |
| Below the poverty line | 2.4% | 10% | 9.6% |
| Average trip to work | 23 minutes | 28 minutes | 25 minutes |
| Working residents who work in town | 2% | 6.6% | 8% |
Census LEHD 2023 · ACS
The typical Penryn home is worth about $943,000, up 2.4% in a year, 24% above the California typical home.
Zillow Home Value Index · Redfin Data Center
Penryn has mild winters and hot summers. The July high in Penryn is 95°F.
NOAA U.S. Climate Normals, 1991–2020
Expected storm and flood damage is higher than in 56% of U.S. communities.
FEMA National Risk Index · OpenFEMA
0.0 miles of trail in 1 park or preserve.
| Biggest places to walk | Trails | Acres |
|---|---|---|
| 1. Griffith Quarry Historic Park | — | 25 |
Trails & parks © OpenStreetMap contributors · Conserved land: USGS PAD-US
Museums, parks, gardens and other places to visit around Penryn. Close and well known come first.
 23 mi Stadium & arenaARCO Arena
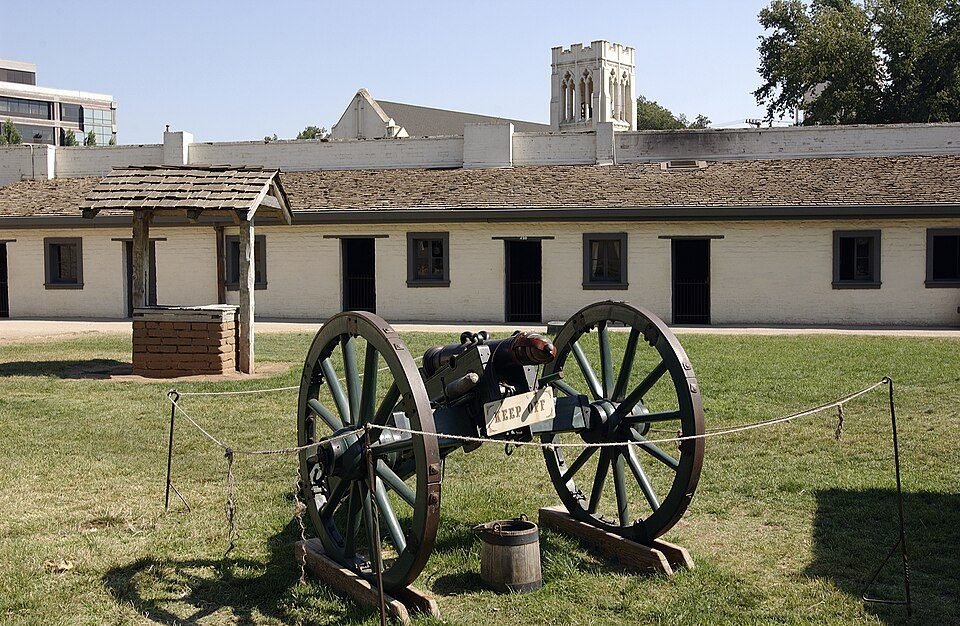 25 mi State parkSutter's Fort
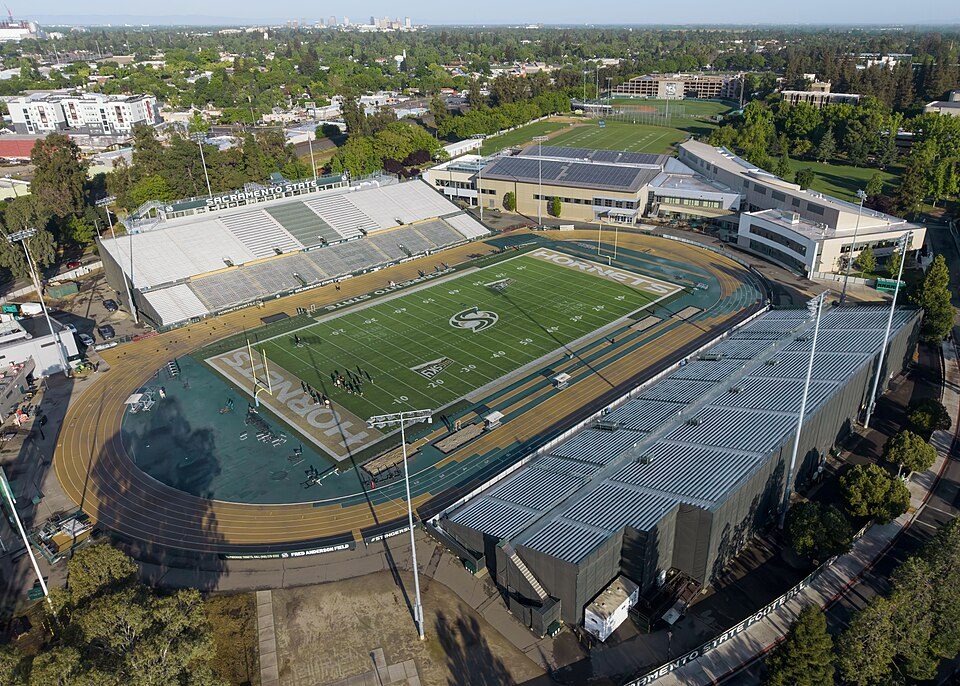 24 mi Stadium & arenaHornet Stadium
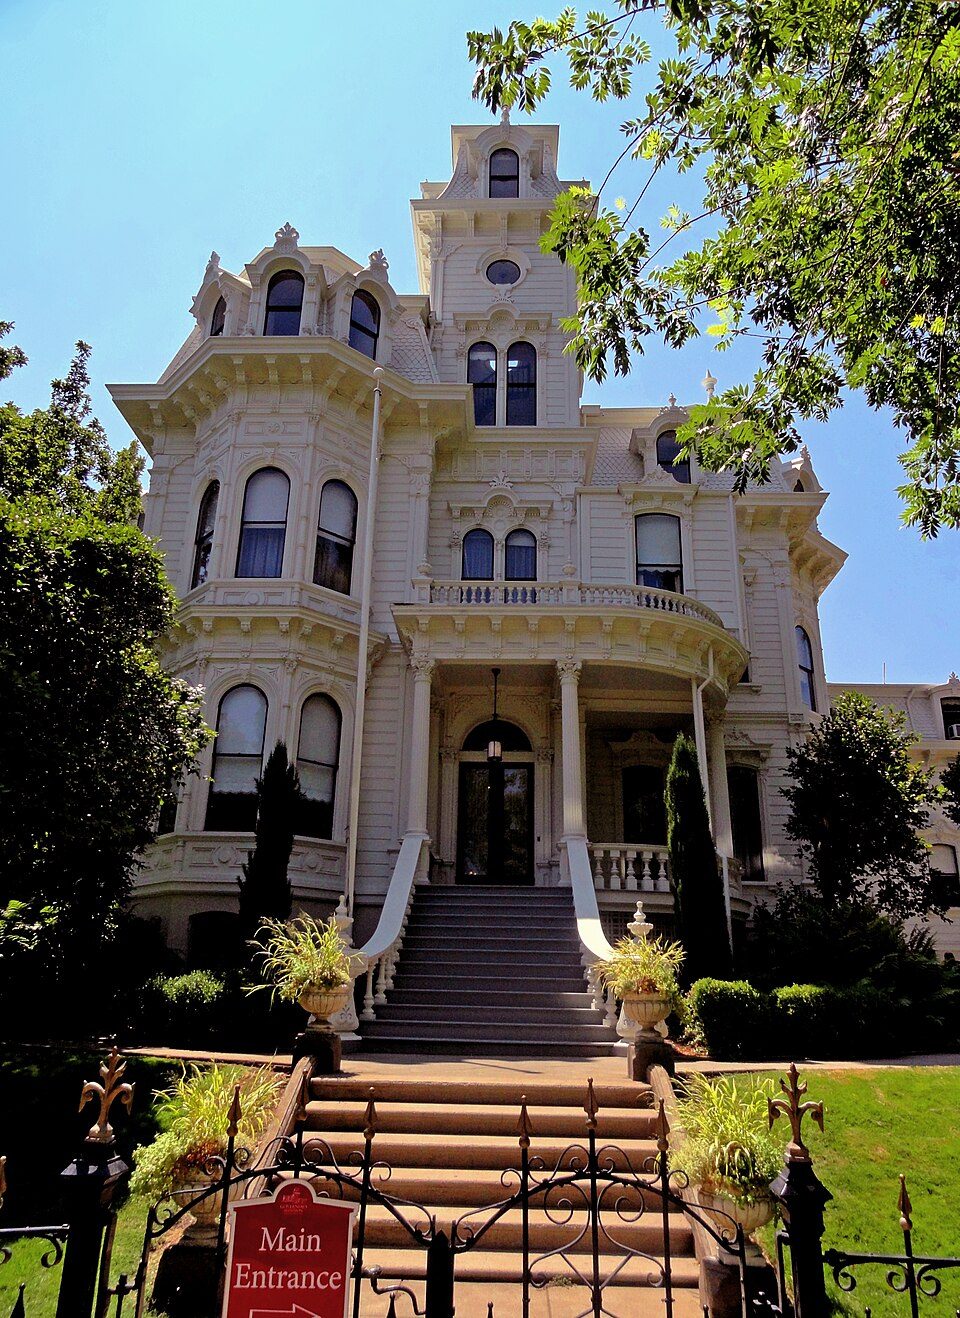 25 mi State parkGovernor's Mansion State Historic Park
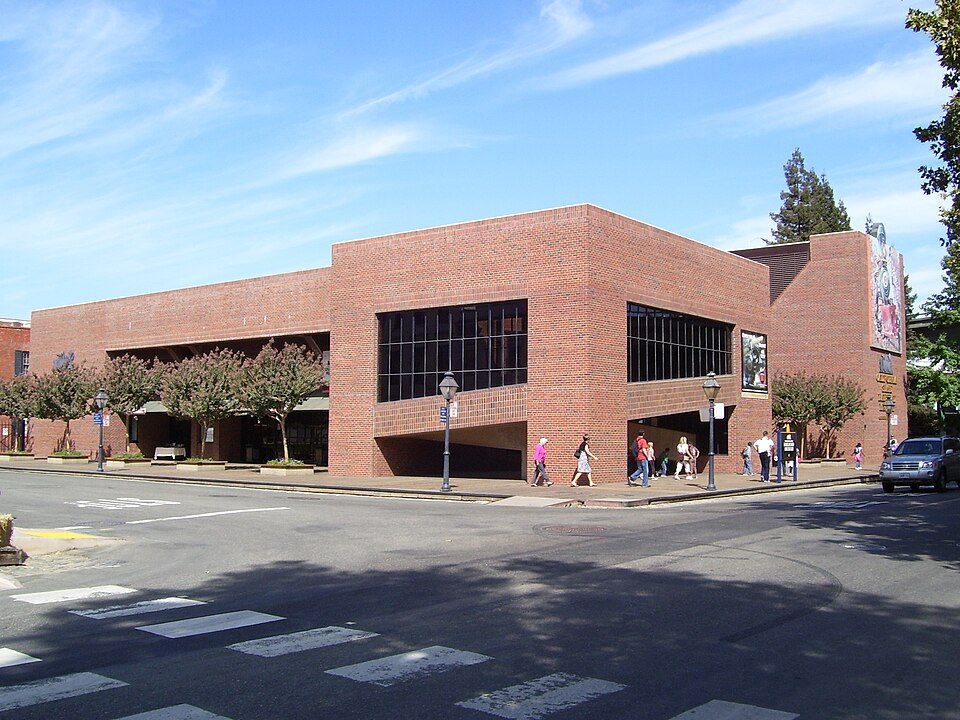 26 mi MuseumCalifornia State Railroad Museum500K visitors a year
 26 mi State parkEmpire Mine State Historic Park
ARCO Arena: CLopez63, CC BY-SA 3.0 · Sutter's Fort: Ian Howard, CC BY 2.5 · Hornet Stadium: Quintin Soloviev, CC BY 4.0 · Governor's Mansion State Historic Park: Mark James Miller, CC BY 3.0 · California State Railroad Museum: The original uploader was Swampyank at English Wikipedia., CC BY-SA 3.0 · Empire Mine State Historic Park: Beej71, CC BY 2.5
3 within 15 miles of the center of Penryn
About 4 of every 100 Penryn residents are enrolled in college, against 8 across California.
Where Penryn’s working residents go each day. Line width shows the share.
Census LEHD 2023
2 places in Penryn on the National Register of Historic Places.
Census-designated place in California, United States
Penryn is a census-designated place in Placer County, California, in the United States. Geographic location is 38°51′08″N 121°10′06″W. Penryn is located 5.5 miles (8.9 km) northeast of Rocklin. The population was 1150 at the 2020 census.
From Wikipedia, licensed CC BY-SA 4.0 · facts via Wikidata (CC0)
Short answers, built from the data on this page.
Public schools that outperform most of California.
That is 9.7 years of the area's median household income ($97,188 across the Sacramento-Roseville-Folsom, CA metro area). Cost of living, which also weighs rents, property taxes and how many households pay 30% or more of their income for housing, grades B−.


