
California - Golden State through High Head Reservoir, 1917
Lucerne Valley’s story
114 years in pictures
The archive holds 10 old photos and papers going back to 1917 and 2 maps from 1947 on.
- 1912Lucerne Valley is settled
Each edition grades its towns against each other only.

Home to 5,957 people, the town was settled in 1912.
More weak spots than strong ones. The weak point is incomes (D−) — the median household income is $55K, and 22% of residents live below the poverty line. A typical home there costs about $256K, 2.9 years of the Riverside metro’s $90K median household income. It also trails on health (D): residents are less healthy than 92% of U.S. towns on CDC estimates. Overall, that makes a D−, better than 3% of U.S. towns. That places it 764th of 841 in California. Hazard risk is weaker too: FEMA rates its natural-hazard risk higher than 90% of U.S. communities, with earthquakes at the top. Lucerne Valley’s average commute is 39 minutes, above both California’s towns (28 minutes) and U.S. towns (25 minutes).
Figures: incomes, Census ACS, 2020–24 · health, CDC PLACES · home values, Zillow · FEMA National Risk Index.
1.9% of the town is conserved land, across 3 parks and preserves.
Each subject compared with towns across the country (schools within California), ordered by how far Lucerne Valley is from typical.
How TownRatings grades towns →
The archive holds 10 old photos and papers going back to 1917 and 2 maps from 1947 on.
Lucerne Valley is unincorporated, so San Bernardino County and regional agencies provide most services.
EPA SDWIS (Oct 9, 2026) · HIFLD + EIA-861 2025 · Census 2020 ZCTAs · NCES 2024–25 · registration: vote.gov, updated Nov 18, 2024.
Ordered by what stands out in Lucerne Valley.
Lucerne Valley has more 90° days than nearly all U.S. towns and has homes that are cheap against local pay, but it has poverty well above the California rate.
In Lucerne Valley, the density of trails is 3.0 miles per square mile. 316 miles of trail in 3 parks and preserves.
| Lucerne Valley | California towns | U.S. towns | |
|---|---|---|---|
| Miles of trail per square mile | 3.0 miles per square mile | 1.0 | 0.4 |
| Conserved land | 1.9% | 4.3% | 4.3% |
| Biggest places to walk | Trails | Acres |
|---|---|---|
| 1. Pioneer Park | — | 17 |
| 2. Midway Park & Arena | — | 5 |
| 3. Russell Park | — | 2 |
Trails & parks © OpenStreetMap contributors · Conserved land: USGS PAD-US
Of its 6 schools, two are listed below, each with the reason. The largest public high school is Granite Mountain Charter, with 4,393 students. The 6 public schools in Lucerne Valley teach 6,077 students between them.
| School | Level | Students | Letter |
|---|---|---|---|
| Lucerne Valley ElementaryLargest public elementary schoolGrades K–6 | Grades K–6 | 646 | – |
| Lucerne Valley HighLargest public high schoolGrades 9–12 | Grades 9–12 | 322 | – |
NCES · EDFacts · graded within CA on state tests and graduation
At 2.9 years of the Riverside metro’s $90K median household income, the typical home (about $256K) costs less against local pay than in 98% of California towns; that ratio is one input to that grade. The typical value, about $256K, is 8% below its June 2022 peak.
The typical Lucerne Valley home is worth about $256,000, up 1.9% in a year, 66% below the California typical home. The town’s rent at the middle of the market is $1,181 a month. A home in Lucerne Valley typically sold within 43 days of listing.
| Lucerne Valley | California towns | U.S. towns | |
|---|---|---|---|
| Median rent | $1,181 a month | $1,898 a month | $1,185 a month |
| Households that own their home | 76% | 64% | 73% |
Census ACS, 2020–24 · Zillow Home Value Index · Redfin Data Center
This California town beats the California average on 1 of 32 CDC measures and trails it on 24. In Lucerne Valley, 43% of adults have high blood pressure.
| Lucerne Valley | California towns | U.S. towns | |
|---|---|---|---|
| Fair or poor health (CDC PLACES) | 34% | 22% | 19% |
| Frequent physical distress (CDC PLACES) | 20% | 14% | 14% |
| Diabetes (CDC PLACES) | 17% | 12% | 12% |
| High blood pressure (CDC PLACES) | 43% | 31% | 35% |
| What stands out | Lucerne Valley | CA |
|---|---|---|
| More adults treating high blood pressure | 75.6% | 71.3% |
| More adults with COPD | 11.5% | 5.1% |
CDC PLACES 2025 · modeled estimates for adults · CMS · HRSA
44% of Lucerne Valley’s expected losses from natural hazards come from earthquakes, followed by inland flooding at 43%. Federal disaster aid has reached households in Lucerne Valley after 4 declared disasters, most recently in 2023.
FEMA disaster declarations and aid · FEMA National Risk Index · OpenFEMA
The average commute for its 2,563 working residents takes 39.2 minutes, against 28.7 across California. Jobs based here grew from 420 in 2013 to 915.
Half commute less than 64 miles. Jobs in Lucerne Valley grew by 495 from 2013 to 2023, reaching 915. Commuting out is the norm here: 6% of working residents work locally. The top destinations are Los Angeles (10%), Victorville (5%) and Apple Valley (4%).
| Lucerne Valley | California towns | U.S. towns | |
|---|---|---|---|
| Average trip to work | 39 minutes | 28 minutes | 25 minutes |
| Below the poverty line | 22% | 10% | 9.6% |
| Median household income | $55,000 | $95,000 | $80,000 |
Census LEHD 2023 · ACS
The Victorville weather station, 23 miles away, records that about 119 days a year reach 90°, more than in 98% of U.S. towns. July afternoons average 97.5°, hotter than in 98% of U.S. towns; January nights average 34.3°.
Snow almost never falls. The July high for Lucerne Valley comes to 98°F.
| Lucerne Valley | California towns | U.S. towns | |
|---|---|---|---|
| July high | 98°F | 89°F | 85°F |
| January low | 34°F | 41°F | 22°F |
NOAA U.S. Climate Normals, 1991–2020
Museums, parks, gardens and other places to visit around Lucerne Valley. Close and well known come first.
 Big draw36 mi National ParkJoshua Tree National Park2.9M visitors a year
 15 mi LakeBig Bear Lake
 24 mi MountainSan Gorgonio Mountain
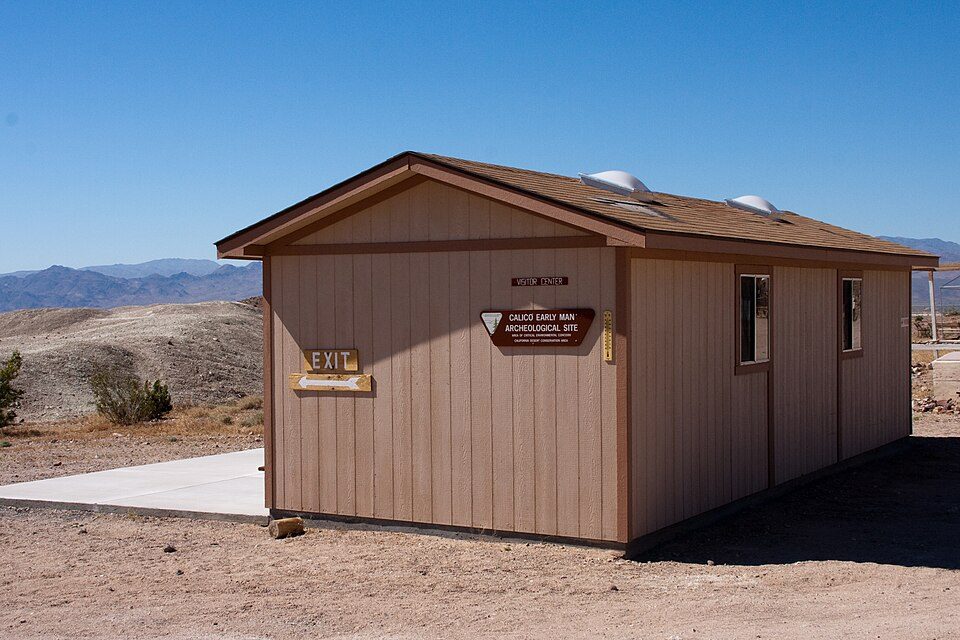 36 mi Ancient siteCalico Early Man Site
 33 mi TheatreGlen Helen Amphitheater
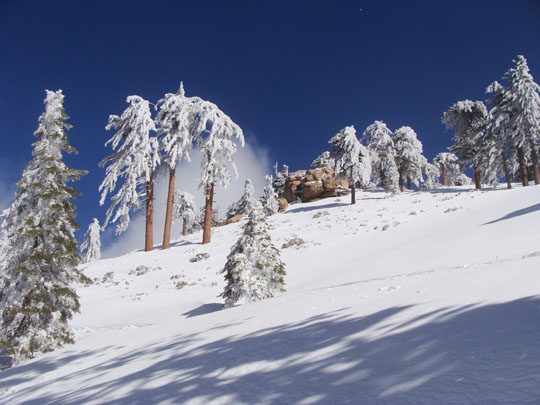 18 mi Ski areaSnow Valley Mountain Resort42 runs · 1,109 ft vertical
Joshua Tree National Park: Sergiy Galyonkin, CC BY-SA 4.0 · Big Bear Lake: H.G. Judd, CC BY-SA 3.0 · San Gorgonio Mountain: Doc Searls, CC BY-SA 2.0 · Calico Early Man Site: Ellen Levy Finch (Elf), CC BY-SA 3.0 · Glen Helen Amphitheater: Alonzo, CC BY 2.0 · Snow Valley Mountain Resort: Me, CC BY-SA 4.0
None within 15 miles of Lucerne Valley; the nearest are
About 4 of every 100 Lucerne Valley residents are enrolled in college, against 8 across California.
Where Lucerne Valley’s working residents go each day. Line width shows the share.
Census LEHD 2023
Census-designated place in California, United States
Lucerne Valley is a census-designated place (CDP) and valley landform in the southern Mojave Desert, in western San Bernardino County, California. As of the 2020 census, Lucerne Valley had a population of 5,331.
From Wikipedia, licensed CC BY-SA 4.0 · facts via Wikidata (CC0)
Short answers, built from the data on this page.
Lucerne Valley grades D− overall, better than 3% of U.S. towns and #764 of 841 in California. It grades D for health and C for schools. Jobs & income is its weak spot, with a D−.
Cost of living, which also weighs rents, property taxes and how many households pay 30% or more of their income for housing, grades B−.


