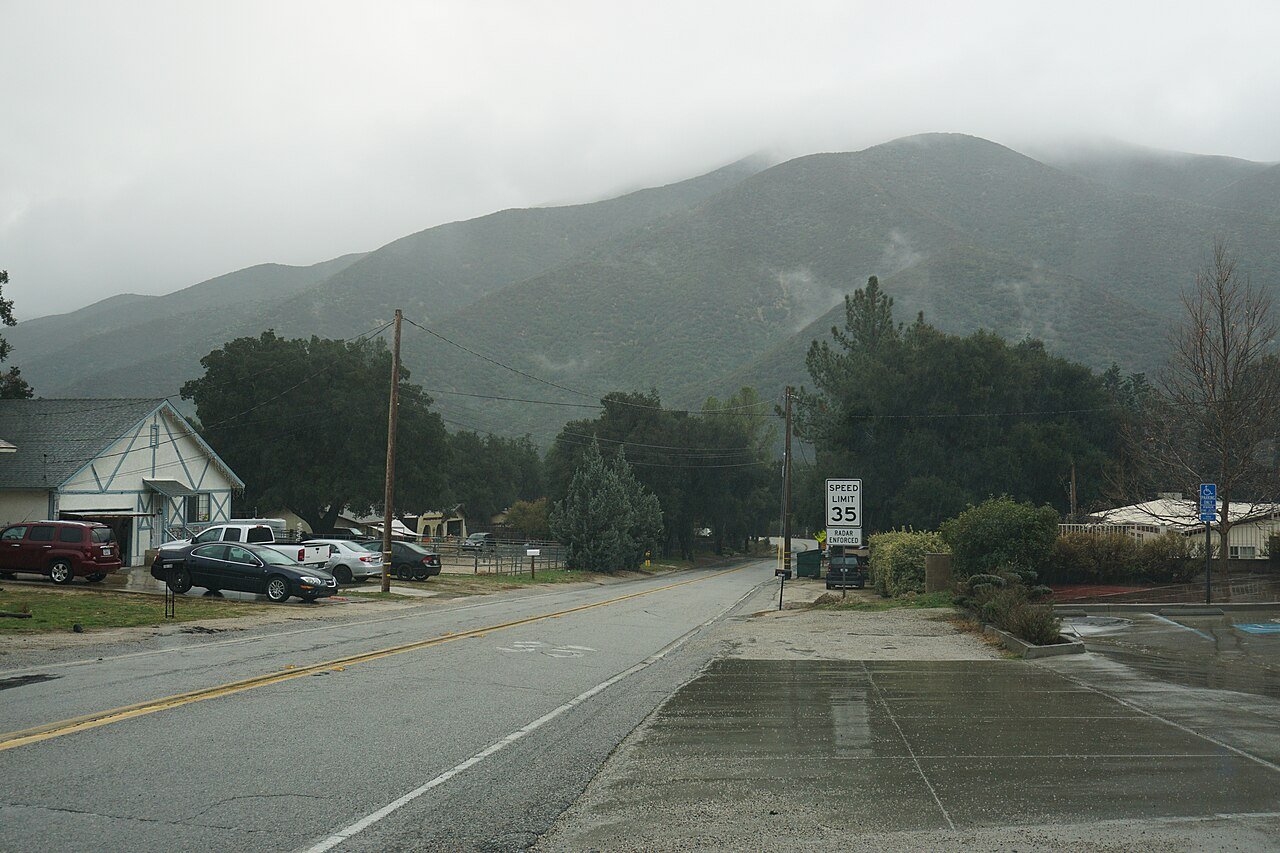
 Photo: Chevy111 · CC BY-SA 4.0
Green Valley reaches 100° on about 11 days a year, more than 91% of U.S. towns
In January the night’s low is typically 39°. From frosty January to warm July, readings climb 53°. Precipitation is light here, less than falls on 93% of U.S. towns. Seedlings are safe outdoors from about April 6, with the first autumn frost due around November 29.
A year in Green Valley at a glance
Each month’s typical high and low, and what it brings.
What stands out about Green Valley’s climate
Compared with towns across the U.S., with Green Valley’s place in California beside it.
What a year in Green Valley feels like
Typical highs and lows by season and by month, from NOAA’s 30-year normals.
About 236 frost-free days a year
In half of years the last 32° night comes by April 6 and the first by November 29. Frost and day counts come from NOAA’s station at Fairmont, CA, 6 miles from the town’s center, 430 ft lower.
The 2023 USDA map puts Green Valley’s center in zone 9b: the coldest night of a typical winter, averaged over 1991–2020, reaches about 25°. Plant labels use the zone; frost dates tell you when to plant.
Freezing nights by month
Average nights at or below 32°
90° days by month
Average days at 90° or more
About 15 inches of rain a year
February is the wettest month and August the driest. Rain falls on about 45 days a year. Snow is rare: about 0.0" in a normal year at Saugus Pwr Plt 1, CA, so most winters see none.
Rain + melted snow by month
Inches of water
Heating and cooling a home in Green Valley
61% of the work is heating. Months averaging under 55° run from November through March.
Degree days add up how far each day’s average falls below (heating) or rises above (cooling) 65° over a year. NOAA normals at Fairmont, CA.
Living with Green Valley’s climate
What the numbers mean for a garden, a free afternoon and a bad-weather day.
236 frost-free days in zone 9b. The last frost comes by Apr 6 in half of years, so many gardeners wait a week or two past that to set out tomatoes. The first fall frost comes by Nov 29.
Months with highs of 62–84° and lows of 40° or more: March, April, May, June, October and November. 26 miles of trails are waiting.
Parks & trails →Of the yearly building losses FEMA expects in Green Valley from natural hazards, avalanches are the largest share (41%). Normals are averages; the hazards page covers the extremes.
Natural hazards →Green Valley and similar climates
TownRatings has no climate map of the towns around Green Valley yet.
Climates most like Green Valley’s, farther away
TownRatings’ own comparison of NOAA 1991–2020 normals, not a NOAA product: places of 5,000+ at least 150 miles away, one per state, closest on January low, July high, precipitation and snow.
| Town | Jan. low | July high | Precip. | Snow |
|---|---|---|---|---|
| Green Valley, CA | 39° | 91° | 15" | 0.0" |
| Sierra Vista, AZ | 32° | 91° | 14" | 0.4" |
| Ashland, OR | 31° | 91° | 19" | 0.5" |
| Alpine, TX | 30° | 90° | 15" | 2.2" |
| Finley, WA | 29° | 91° | 9" | 2.0" |
Temperatures and precipitation come from NOAA’s 5 km grid; snow and day counts from the stations named on this page.
Warmer than it used to be
The last 30 years in Green Valley averaged 2.1° warmer than the 1900s. The biggest change is in March (+2.8°).
A bigger shift than in 94% of U.S. towns.
Change by month
The two periods overlap (1991–2000 is in both), which makes the gap a little smaller than it would be between separate periods.
How Green Valley compares
Against 12,954 U.S. towns of 2,500 or more (one per 5 km climate cell), with Green Valley’s place among California’s.
Green Valley weather by month
Highs, lows and precipitation from NOAA’s grid at Green Valley’s center; snow, wet days and snow on the ground from Saugus Pwr Plt 1, CA. 1991–2020 normals.
| Month | High | Low | Rain + melt | Snow | Wet days | Snow on ground | 30-yr range |
|---|---|---|---|---|---|---|---|
| January | 56° | 39° | 3.0" | 0.0" | 7 | 0 | 43° – 54° |
| February | 57° | 39° | 4.1" | 0.0" | 8 | 0 | 41° – 56° |
| March | 62° | 41° | 2.5" | 0.0" | 7 | 0 | 44° – 59° |
| April | 67° | 44° | 1.1" | 0.0" | 4 | 0 | 49° – 60° |
| May | 75° | 51° | 0.3" | 0.0" | 3 | 0 | 54° – 70° |
| June | 84° | 59° | 0.1" | 0.0" | 1 | 0 | 64° – 78° |
| July | 91° | 65° | 0.1" | 0.0" | 1 | 0 | 71° – 83° |
| August | 92° | 65° | 0.0" | 0.0" | 0 | 0 | 76° – 82° |
| September | 86° | 61° | 0.1" | 0.0" | 1 | 0 | 68° – 78° |
| October | 75° | 53° | 0.6" | 0.0" | 3 | 0 | 60° – 70° |
| November | 63° | 44° | 0.9" | 0.0" | 4 | 0 | 45° – 59° |
| December | 55° | 39° | 2.3" | 0.0" | 6 | 0 | 42° – 52° |
| Year | 72° | 50° | 15.2" | 0.0" | 45 | 0 |
How much a month can swing
A normal is an average. May swings the most: from 1991 to 2020 its average ranged from 54° to 70°. August is the most reliable, staying within 7°.
Where Green Valley’s numbers come from
Normals are 30-year averages, not a forecast. How TownRatings reads climate data →
- Temperatures and precipitation: NOAA’s gridded 1991–2020 normals for the 5 km cell at Green Valley’s center.
- Snow: Saugus Pwr Plt 1, CA.
- Frost, freezing nights, 90° and 100° days, heating and cooling: Fairmont, CA, 6 miles from the town’s center, 430 ft lower; the nearest station that passes our checks for distance, height and agreement with the grid.
- Growing zone: USDA Plant Hardiness Zone Map, 2023. USDA Agricultural Research Service and PRISM Group, Oregon State University, prism.oregonstate.edu/phzm, accessed 8 Oct 2026.
- Then and now: NOAA’s gridded normals for 1901–2000 at the same cell.
- Storms and extremes: FEMA National Risk Index (expected annual losses to buildings).
Common questions about Green Valley’s climate
What is the weather like in Green Valley?
A typical July afternoon reaches 91°, a January night drops to 39°, and snow is almost unheard of. Milder January nights than 87% of U.S. towns; hotter July afternoons than 81% of U.S. towns.
How cold does it get in Green Valley in winter?
December nights average 39°. About 24 nights a year reach 32° or below. In the coldest December of the last 30 years the month averaged 42°.
How much snow does Green Valley get?
About 0.0 inches in a normal winter at Saugus Pwr Plt 1, CA, so most winters see none.
How hot does it get in Green Valley?
July, with a typical high of 91° and a low of 65°. About 74 days a year reach 90° and 11 reach 100° (Fairmont, CA).
When is the first and last frost in Green Valley?
In half of years the last spring frost (32°) comes by April 6 and the first fall frost by November 29, about 236 frost-free days, at Fairmont, CA.
What growing zone is Green Valley in?
Zone 9b on the 2023 USDA Plant Hardiness Zone Map: the coldest night of a typical winter reaches about 25°.
What is the best time of year to visit Green Valley?
By one simple rule (highs of 62–84° and lows of 40° or more), March, April, May, June, October and November. The rule is ours, not NOAA’s; the month table has the numbers to judge by.
Is Green Valley getting warmer?
Yes: 1991–2020 averaged 2.1° warmer than 1901–2000 on NOAA’s grid. A bigger shift than 94% of U.S. towns.
Neighbors talk weather
Gardens, snow, and the best days of the year in Green Valley.
Source: NOAA NCEI U.S. Climate Normals, 1991–2020 and 1901–2000; USDA/PRISM 2023 hardiness zones; FEMA National Risk Index. Today’s forecast: National Weather Service.