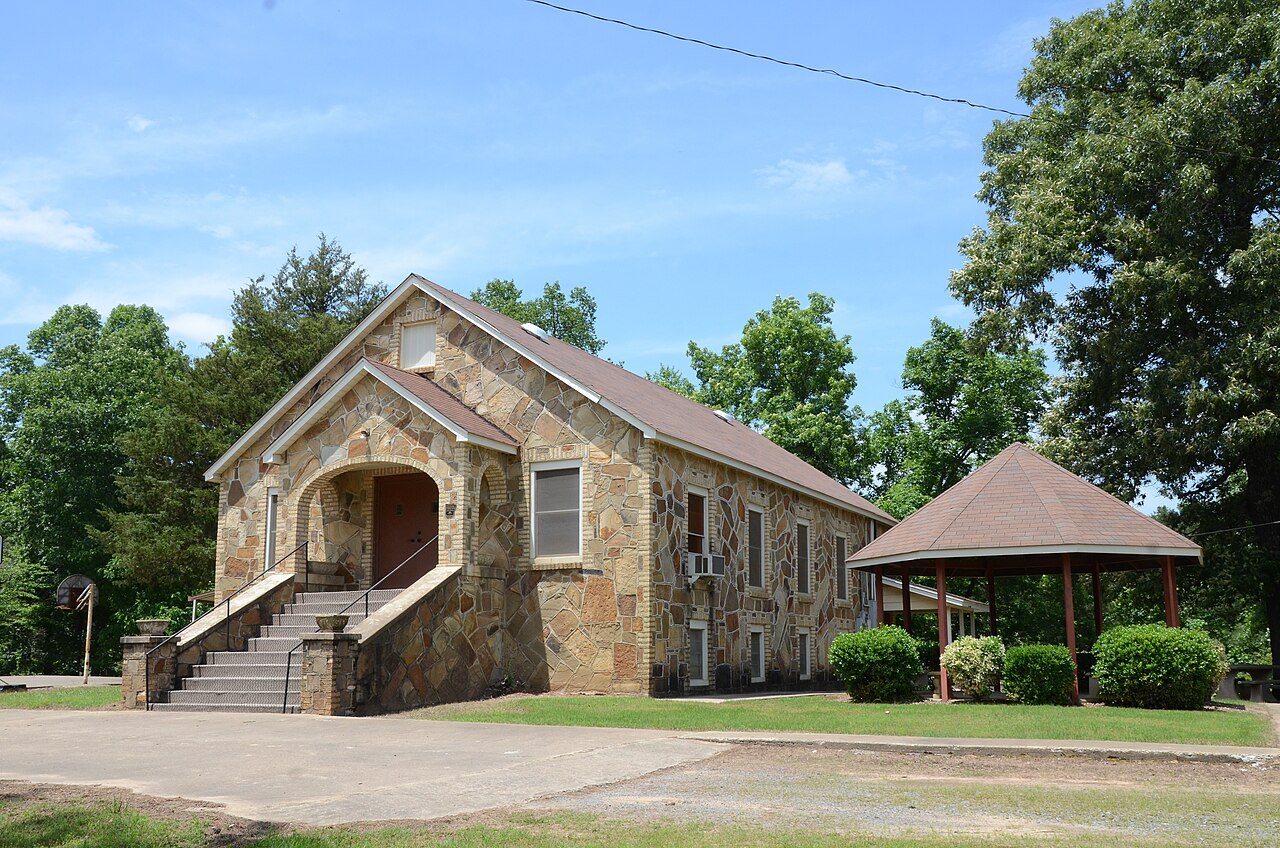
 Mellettown United Methodist Church · Photo: Valis55 · CC BY-SA 3.0
Springfield’s public schools
South Conway County School District and Nemo Vista School District have no state test or graduation results we can use, so there is no Schools grade for Springfield. Each school below is shown with its own results.
Tests spring 2022, when 100% of students in Arkansas’s tested grades sat them, and the class of 2023’s graduation rate (U.S. Department of Education). How TownRatings grades schools
Springfield’s schools, in brief
School by school
4 of Springfield’s 5 district schools with test results score above the middle of Arkansas’s 944 public schools. Nemo Vista Middle School places highest (better than 89%); Morrilton Senior High School lowest (34%). See the path ↓
Which school depends on your street
Two elementary schools serve Springfield, graded from B+ to B+, so it’s worth checking the specific school. Then two middle schools and two high schools: Morrilton Senior High School and Nemo Vista High School. See the path ↓
Written from the figures on this page. Tests are from 2021–22, graduation from the class of 2023; each school’s own letter uses 2020–21 results.
Where will my kid go?
Pick a grade. These are the public schools in Springfield, with each school’s own grade.
Pre-K in Springfield · depends on your address
Morrilton Primary School
Grades PK–1 · 432 students · 22:1 students per teacher · in Morrilton
Nemo Vista Elementary School
Grades PK–5 · 274 students · 15:1 students per teacher · in Center Ridge
Kindergarten in Springfield · depends on your address
Morrilton Primary School
Grades PK–1 · 432 students · 22:1 students per teacher · in Morrilton
Nemo Vista Elementary School
Grades PK–5 · 274 students · 15:1 students per teacher · in Center Ridge
1st grade in Springfield · depends on your address
Morrilton Primary School
Grades PK–1 · 432 students · 22:1 students per teacher · in Morrilton
Nemo Vista Elementary School
Grades PK–5 · 274 students · 15:1 students per teacher · in Center Ridge
2nd grade in Springfield · depends on your address
Morrilton Elementary School
Grades 2–3 · 311 students · 16:1 students per teacher · in Morrilton
Nemo Vista Elementary School
Grades PK–5 · 274 students · 15:1 students per teacher · in Center Ridge
3rd grade in Springfield · depends on your address
Morrilton Elementary School
Grades 2–3 · 311 students · 16:1 students per teacher · in Morrilton
Nemo Vista Elementary School
Grades PK–5 · 274 students · 15:1 students per teacher · in Center Ridge
4th grade in Springfield · depends on your address
Morrilton Intermediate School
Grades 4–6 · 539 students · 16:1 students per teacher · in Morrilton
Nemo Vista Elementary School
Grades PK–5 · 274 students · 15:1 students per teacher · in Center Ridge
5th grade in Springfield · depends on your address
Morrilton Intermediate School
Grades 4–6 · 539 students · 16:1 students per teacher · in Morrilton
Nemo Vista Elementary School
Grades PK–5 · 274 students · 15:1 students per teacher · in Center Ridge
6th grade in Springfield · depends on your address
Morrilton Intermediate School
Grades 4–6 · 539 students · 16:1 students per teacher · in Morrilton
Nemo Vista Middle School
Grades 6–8 · 109 students · 10:1 students per teacher · in Center Ridge
7th grade in Springfield · depends on your address
Morrilton Junior High School
Grades 7–8 · 362 students · 11:1 students per teacher · in Morrilton
Nemo Vista Middle School
Grades 6–8 · 109 students · 10:1 students per teacher · in Center Ridge
8th grade in Springfield · depends on your address
Morrilton Junior High School
Grades 7–8 · 362 students · 11:1 students per teacher · in Morrilton
Nemo Vista Middle School
Grades 6–8 · 109 students · 10:1 students per teacher · in Center Ridge
9th grade in Springfield · depends on your address
Morrilton Senior High School
Grades 9–12 · 688 students · 5:1 students per teacher · in Morrilton
Nemo Vista High School
Grades 9–12 · 130 students · 3:1 students per teacher · in Center Ridge
10th grade in Springfield · depends on your address
Morrilton Senior High School
Grades 9–12 · 688 students · 5:1 students per teacher · in Morrilton
Nemo Vista High School
Grades 9–12 · 130 students · 3:1 students per teacher · in Center Ridge
11th grade in Springfield · depends on your address
Morrilton Senior High School
Grades 9–12 · 688 students · 5:1 students per teacher · in Morrilton
Nemo Vista High School
Grades 9–12 · 130 students · 3:1 students per teacher · in Center Ridge
12th grade in Springfield · depends on your address
Morrilton Senior High School
Grades 9–12 · 688 students · 5:1 students per teacher · in Morrilton
Nemo Vista High School
Grades 9–12 · 130 students · 3:1 students per teacher · in Center Ridge
Which school depends on your address. To confirm it, ask the South Conway County School District.
Two districts serve Springfield
Spending and class size are shown but don’t count toward the grade. Each district’s own page has every school.
Close to the state in reading
Springfield vs. its neighbors
Schools grades for the Arkansas towns that share Springfield’s borders.
| Town | Schools | Main districts |
|---|---|---|
| Springfield | — | South Conway County PK–12 · Nemo Vista PK–12 |
Every school in Springfield
6 schools. Each public school’s letter compares its own 2020–21 reading and math results with Arkansas’s other public schools (the newest school-level results we have).
Questions about Springfield’s schools
Are Springfield’s schools good?
There’s no Schools grade for Springfield. South Conway County School District and Nemo Vista School District have no state test or graduation results we can use, so there is no Schools grade for Springfield. Each school below is shown with its own results. School by school, 4 of its 5 district schools with test results score above the middle of Arkansas’s public schools on their 2020–21 results.
What school district is Springfield in?
South Conway County School District and Nemo Vista School District.
Where do Springfield kids go to high school?
One of two high schools, depending on your address: Morrilton Senior High School and Nemo Vista High School.
Parents talk
What Springfield families are saying about school.
Looking for colleges? Colleges near Springfield → They have their own page.
School data: state test results (2021–22, with participation) and four-year graduation rates (class of 2023) reported to the U.S. Department of Education (EDFacts via ED Data Express); each school’s own letter uses its 2020–21 results (EDFacts via the Urban Institute); schools and enrollment from NCES (2024–25; private schools 2023–24); spending from the Census Bureau’s school finance survey (FY2024). Stars are from neighbors.