Is Glenmore a good place to live?
The best of Glenmore’s subject grades are an A for incomes and schools; the weakest is a D for walkability. On the outdoors, just 53 of Wisconsin’s 879 towns do worse. Glenmore has fewer than 2,500 residents, so it gets subject grades but no overall grade.
What makes Glenmore stand out
Where Glenmore beats most towns.
1,050 people, and everyone knows the way
In a town this size, neighbors are the best guide. Ask them anything.
How Glenmore grades
Each subject compared with towns across the country (schools within Wisconsin), ordered by how far Glenmore is from typical.
How TownRatings grades towns →
Moving to Glenmore: who provides what
Who provides power, water and the rest in Glenmore, and how to reach them.
EPA SDWIS (Oct 9, 2026) · HIFLD + EIA-861 2025 · Census 2020 ZCTAs · NCES 2024–25 · registration: vote.gov, updated Nov 18, 2024.
The data
Ordered by what stands out in Glenmore.
Fewer of Glenmore’s working residents work locally than in the typical Wisconsin or U.S. town
For Glenmore, the average trip to work is 19 minutes. Jobs based locally fell to 220 in 2023, 53 fewer than in 2013. Also worth knowing: among residents locally, 3% live below the poverty line, against 6.4% in Wisconsin’s towns and 9.6% across U.S. towns. 6.9% of workers work from home locally.
| Glenmore | Wisconsin towns | U.S. towns | |
|---|---|---|---|
| Average trip to work | 19 minutes | 22 minutes | 25 minutes |
| Below the poverty line | 3% | 6.4% | 9.6% |
| Work from home | 6.9% | 12% | 11% |
| Working residents who work in town | 0.9% | 8.3% | 8% |
Where working residents work
Census LEHD 2023 · ACS
Residents of Glenmore are healthier than seven in ten U.S. towns
Among adults in Glenmore, 40% have obesity, where Wisconsin’s towns sit at 38% and U.S. towns at 35%. For adults locally, the share who sleep under 7 hours is 30%. In Glenmore, 20% of adults binge drink, and 30% have high blood pressure.
| Glenmore | Wisconsin towns | U.S. towns | |
|---|---|---|---|
| Sleep under 7 hours (CDC PLACES) | 30% | 32% | 36% |
| Binge drink (CDC PLACES) | 20% | 20% | 16% |
| High blood pressure (CDC PLACES) | 30% | 33% | 35% |
| Feel lonely (CDC PLACES) | 29% | 30% | 33% |
| What stands out | Glenmore | WI |
|---|---|---|
| Fewer older adults who have lost all their teeth | 7.9% | 9.9% |
| Fewer adults facing food insecurity | 9.8% | 12.1% |
CDC PLACES 2025 · modeled estimates for adults · CMS · HRSA
Typical low → high °F
NOAA U.S. Climate Normals, 1991–2020
Fewer children than Wisconsin overall
The share of residents in Glenmore who are under 18: 15%. Children under 18 are 15% of residents (21% statewide); people 65 and older are 24% of residents (19% statewide). Its age of the median resident comes in at 47.8 years. Among adults 25 and older, 35% have a four-year degree or more, against 33% across Wisconsin.
| Glenmore | Wisconsin towns | U.S. towns | |
|---|---|---|---|
| Under 18 | 15% | 21% | 22% |
| Median age | 47.8 years | 42.1 years | 40.5 years |
| Aged 65 or older | 24% | 20% | 18% |
| Bachelor’s degree or more, 25+ | 35% | 32% | 29% |
Ages · share of residents
Education · adults 25 and older
Women and men · all residents
49% women, 51% men
That’s an even split within the survey’s margin of ±4.8 points. Across Wisconsin, 49.9% of residents are women.
| Glenmore | WI | U.S. | |
|---|---|---|---|
| Under 10 | 4.9% | 11.2% | 11.6% |
| 10 to 17 | 10.3% | 10.2% | 10.3% |
| 18 to 24 | 13.3% | 9.3% | 9.1% |
| 25 to 34 | 8.6% | 12.6% | 13.7% |
| 35 to 44 | 7.6% | 12.7% | 13.2% |
| 45 to 54 | 9.9% | 11.8% | 12.2% |
| 55 to 64 | 21% | 13.8% | 12.7% |
| 65 to 74 | 19.4% | 11.2% | 10.2% |
| 75 and older | 4.8% | 7.3% | 7% |
| No diploma | 6.2% | 6.4% | 10.4% |
| High school | 29.7% | 29.4% | 26% |
| Some college | 19.9% | 19.5% | 19.1% |
| Associate’s | 9.2% | 11.3% | 8.8% |
| Bachelor’s | 27.2% | 22% | 21.6% |
| Graduate | 7.7% | 11.4% | 14.1% |
U.S. Census Bureau · ACS 2020-2024 5-year estimates · in a town of 1,100, single groups can be off by several points
Top of a moderate hazard risk in Glenmore: inland flooding
Of the losses FEMA expects in Glenmore, 72% come from inland flooding and 15% from cold waves. Compared with 53% of U.S. communities, expected storm and flood damage locally is higher. Since 2004, Glenmore has seen 2 flood insurance claims paid out.
FEMA flood insurance claims · FEMA National Risk Index · OpenFEMA
0% of Glenmore is conserved land
There are 0.6 miles of trail across 1 park or preserve. Parks and preserves in Glenmore: one, of 2 acres.
| Biggest places to walk | Trails | Acres |
|---|---|---|
| 1. Van Straten Park | 0.1 mi | 2 |
Trails & parks © OpenStreetMap contributors · Conserved land: USGS PAD-US
Lambeau Field and 14 more within 40 miles
Museums, parks, gardens and other places to visit around Glenmore. Close and well known come first.
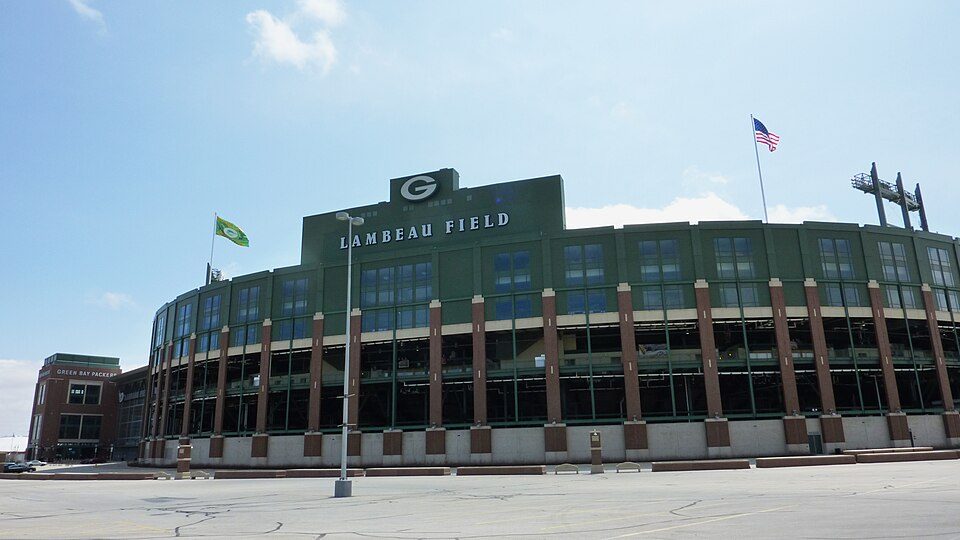 Big draw11 mi Stadium & arenaLambeau Field
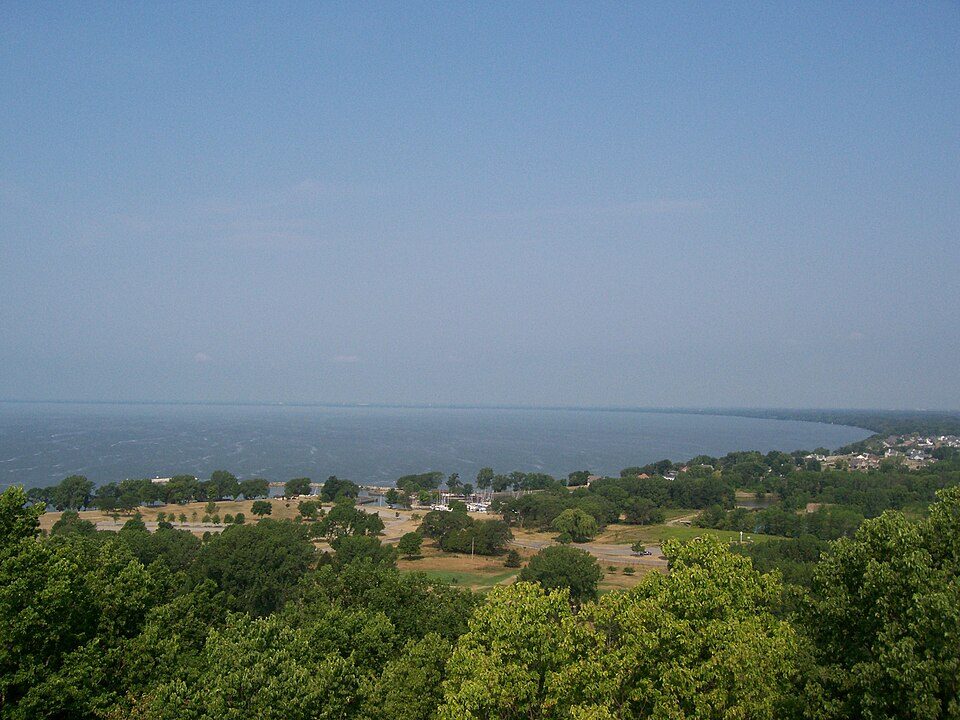 34 mi LakeLake Winnebago
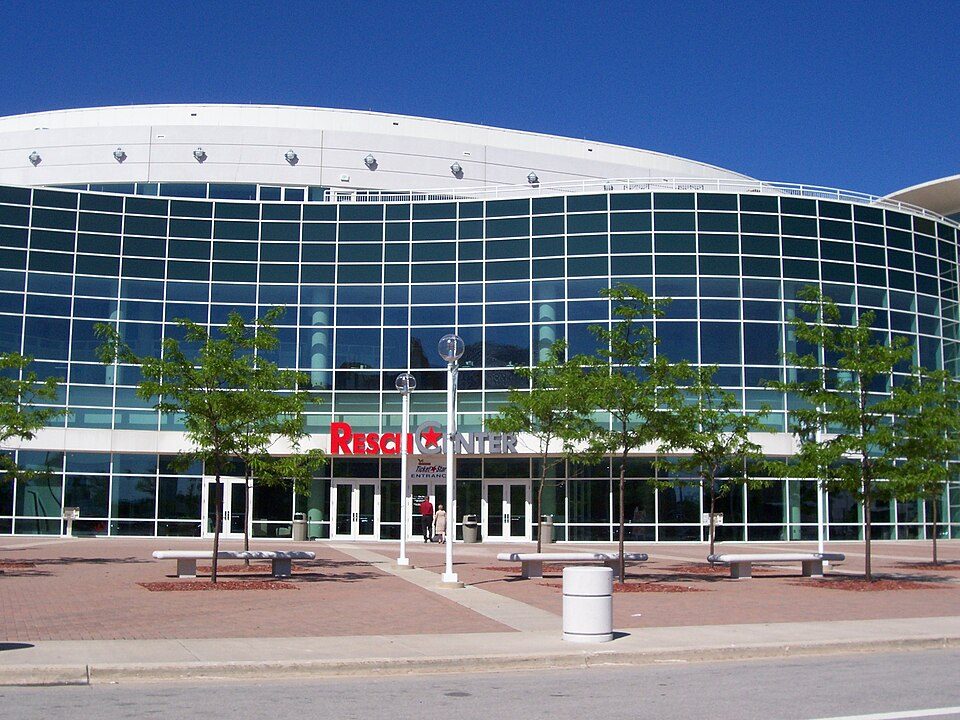 10 mi Stadium & arenaResch Center
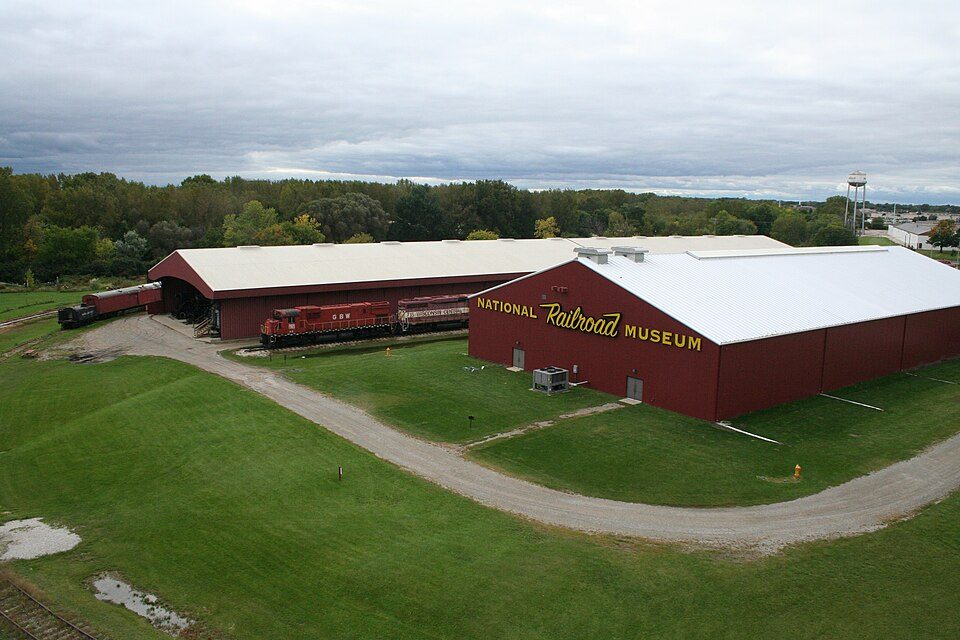 9 mi MuseumNational Railroad Museum
 24 mi MuseumUSS Cobia
 11 mi Theme parkBay Beach Amusement Park
Photo credits
Lambeau Field: JL1Row, CC BY-SA 3.0 · Lake Winnebago: self, CC BY-SA 2.5 · Resch Center: User Royalbroil on en.wikipedia, CC BY-SA 2.5 · National Railroad Museum: Dual Freq, CC BY 3.0 · USS Cobia: Unknown authorUnknown author, Public domain · Bay Beach Amusement Park: Royalbroil, CC BY-SA 3.0


Everything we know about Glenmore
Colleges nearby
5 within 15 miles of the center of Glenmore
About 3 of every 100 Glenmore residents are enrolled in college, against 6 across Wisconsin.
99% of working residents leave Glenmore for work
Where Glenmore’s working residents go each day. Line width shows the share.
Census LEHD 2023
About Glenmore
Town in Wisconsin, United States
Glenmore is a town in Brown County in the U.S. state of Wisconsin. The population was 1,045 at the 2020 census.
From Wikipedia, licensed CC BY-SA 4.0 · facts via Wikidata (CC0)
- Area
- 33 sq mi
- Elevation
- 912 ft
- Area code
- 920
Questions about Glenmore
Short answers, built from the data on this page.
Is Glenmore, WI expensive?
Cost of living, which also weighs rents, property taxes and how many households pay 30% or more of their income for housing, grades C+.