Guest, Sign inJoin

Post to Ruston

We’ll email a one-tap link to publish your post. No password, and nothing is public until you click it.
Already a member? Sign in
Point Ruston
Washington›Pierce County

RustonWA

A town of 1,052, incorporated in 1906.

Trash & recycling
Photo: Turtleey · CC BY-SA 4.0
Photo of Ruston

Ruston, WA · Photo: Turtleey · CC BY-SA 4.0 · Source ↗

Is Ruston a good place to live?

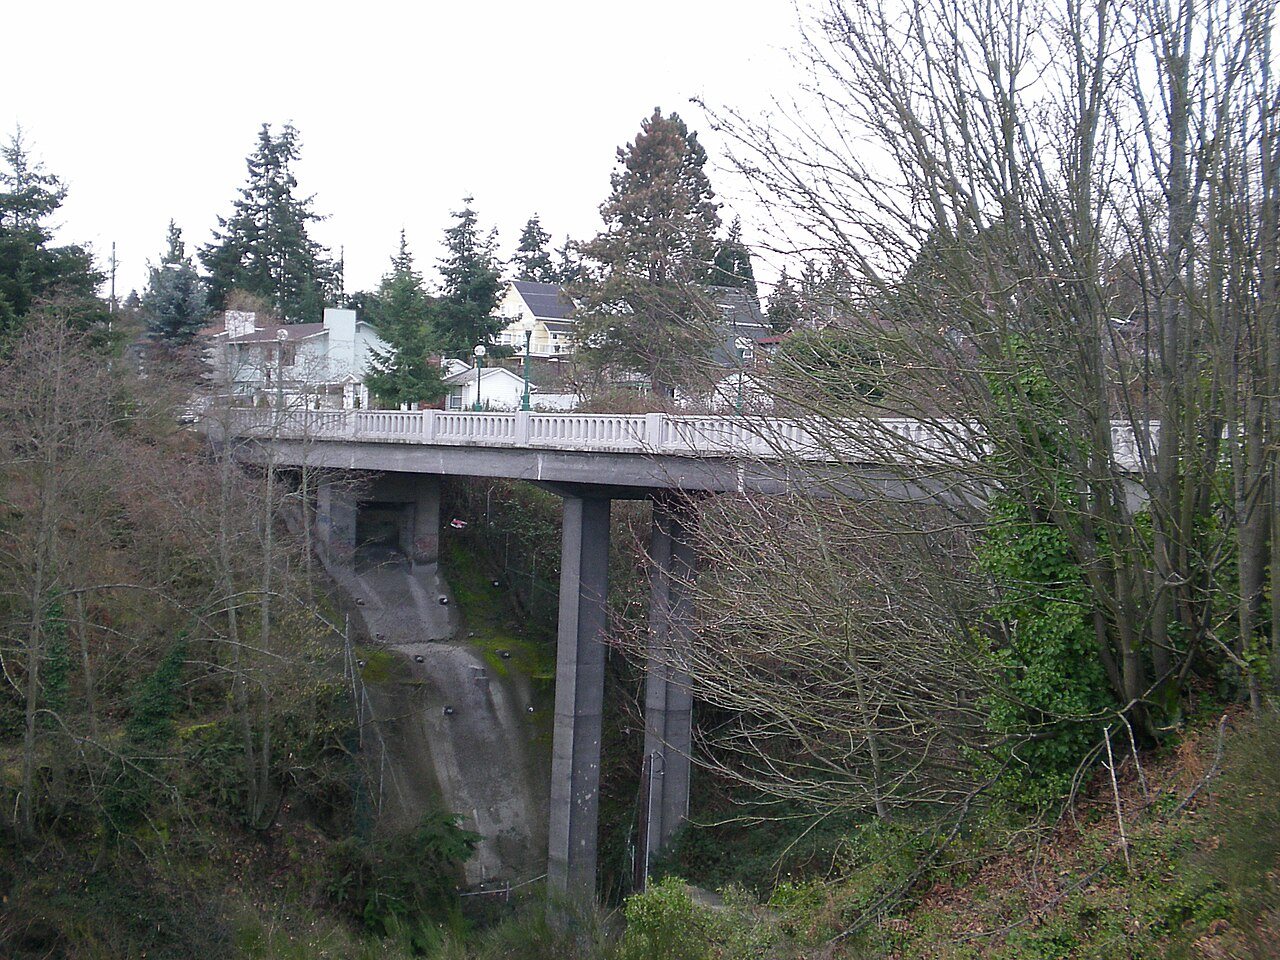
Ruston’s best subject grades are an A for walkability and incomes and an A− for health; its weakest is a D− for safety. Ruston’s median rent is $2,598 a month, against $1,739 a month in Washington’s towns and $1,185 a month across U.S. towns. Only 7 of Washington’s 395 towns score lower on cost of living. FEMA rates its natural-hazard risk higher than 79% of U.S. communities, with earthquakes at the top. Winnifred Street Bridge is on the National Register of Historic Places. Ruston has fewer than 2,500 residents, so it gets subject grades but no overall grade.

What makes Ruston stand out

Where Ruston beats most towns, and one thing worth knowing.

Small town

1,052 people, and everyone knows the way

In a town this size, neighbors are the best guide. Ask them anything.

Nearby towns

How Ruston grades

Each subject compared with towns across the country (schools within Washington), ordered by how far Ruston is from typical.

How grading works

Character Graded, but not part of the overall grade.
Described, not graded Taste, not quality: snow or an older crowd is neither good nor bad.

How TownRatings grades towns →

Winnifred Street Bridge
Winnifred Street Bridge · National Register of Historic Places
Ruston’s story

120 years in pictures

Census counts: 780 in 1910, 1,055 in 2020. The archive holds 12 old photos and papers going back to 1913 and 5 maps from 1953 on.

1 place on the National Register of Historic Places.

  • 1906Ruston is incorporated
Explore the history →
Nearby attractions

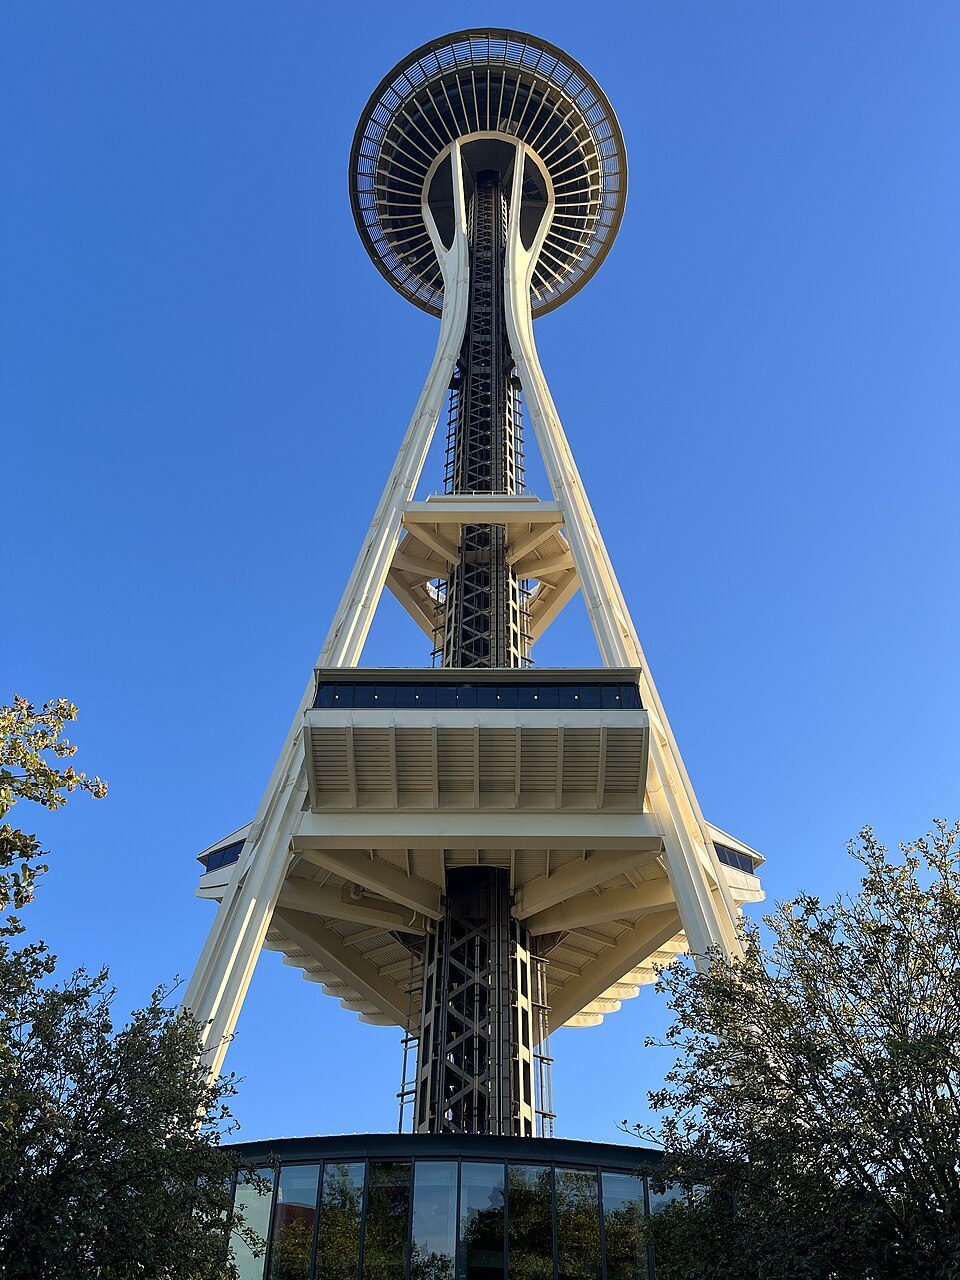
Space Needle and 130 more within 40 miles

Museums, parks, gardens and other places to visit around Ruston. Close and well known come first.

All 151 attractions →
Sources: National Park Service · ski areas © OpenSkiMap / OpenStreetMap contributors · Wikidata · Wikipedia readership · photos via Wikimedia Commons
Photo credits

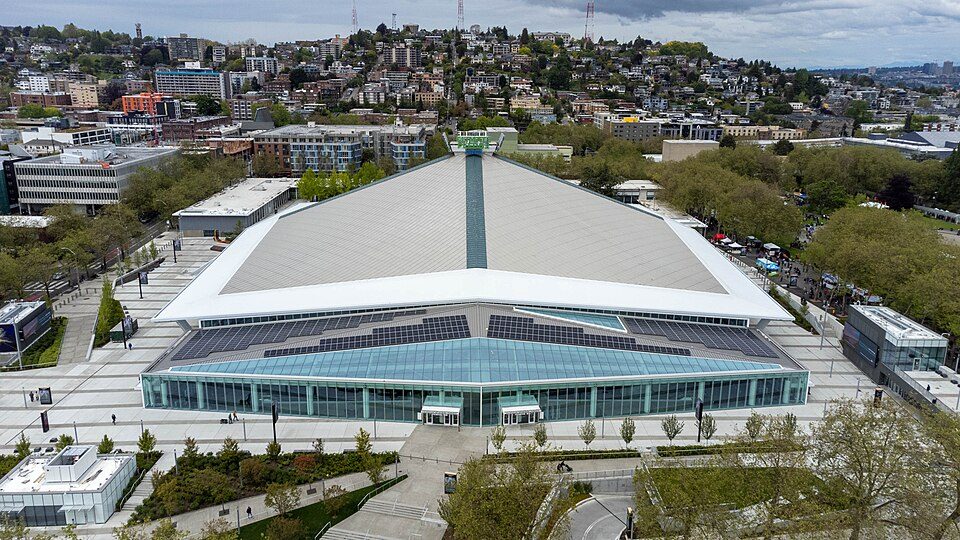
Space Needle: Another Believer, CC BY-SA 4.0 · Lumen Field: "Smart Destinations", GoSeattleCard.com, and Go Seattle Card Blog, CC BY-SA 2.0 · Climate Pledge Arena: Sea Cow, CC BY-SA 4.0 · Tacoma Dome: Broran28, Public domain · T-Mobile Park: MyName (Cacophony), CC BY-SA 3.0 · Seattle Underground: Mark Hursh, CC BY-SA 3.0

Getting set up

Moving to Ruston: who provides what

Who provides power, water and the rest in Ruston, and how to reach them.

The full setup list →
PowerTown of RustonEIAHIFLD · EIA
WaterCity of Tacoma Water DivisionNo health-based violations in 5 years · EPAEPA
Internet5 providers100% of addresses get 100/20 MbpsFCC
Trash & dumpMurrey's DisposalTrash haulerTown site
SchoolsTacoma Public SchoolsWhich school depends on your addressNCES
Register to voteOnlineIn Washington you can register online until 8 days before Election Day, in person up to and including Election Day, or by mail (received 8 days before).vote.gov
Who runs elections herePierce County AuditorPierce County; contacts on the Handbook page.FVAP, Sep 2024
ZIP code9840798407 99%Census 2020

EPA SDWIS (Oct 9, 2026) · HIFLD + EIA-861 2025 · Census 2020 ZCTAs · NCES 2024–25 · registration: vote.gov, updated Sep 30, 2026.

The data

Ordered by what stands out in Ruston.

SafetyD−

Violent crime in Ruston is higher than in the typical Washington or U.S. town

At 7.6 per 1,000 residents, Ruston’s violent crime rate is where Washington’s towns sit at 1.5 and U.S. towns at 1.6. The property crime rate in Ruston is 24.9 per 1,000 residents. Ruston reports more crime per resident than most U.S. towns we grade: about 99% report less.

1%of U.S. towns report more crimeD−Safety Grade
RustonWashington townsU.S. towns
Violent crimes per 1,000 (2025)7.6 per 1,000 residents1.51.6
Property crimes per 1,000 (2025)24.9 per 1,000 residents159.9

Violent crime per 1,000 residents

Ruston7.6
Washington2.9
U.S.3.3

Property crime per 1,000 residents

Ruston24.9
Washington20.2
U.S.15.5
1st
percentile among U.S. towns we grade
8
violent crimes reported in 2025
26
property crimes reported in 2025

FBI crime data, 2025 · crimes reported to police

HealthA−

Ruston ranks healthier than 85% of the country’s towns

Ruston beats the Washington average on 11 of 31 CDC measures and trails it on 5. 15% of adults get no exercise outside work in Ruston.

85%healthier than U.S. townsA−Health Grade
RustonWashington townsU.S. towns
Get no exercise (CDC PLACES)15%18%25%
Smoke cigarettes (CDC PLACES)8.8%11%14%
Frequent mental distress (CDC PLACES)15%17%17%
Yearly checkup (CDC PLACES)75%71%79%
31 measures vs. Washington
11 better15 too close to call5 worse
What stands outRustonWA
Fewer uninsured adults5.1%8.4%
Fewer adults facing food insecurity6.7%10.2%
More adults who have had cancer10.2%7.9%
Tacoma General Allenmore Hospital
3.7 mi away · emergency room
None
primary care, dental or mental-health shortage

CDC PLACES 2025 · modeled estimates for adults · CMS · HRSA

79risk score of 100
FEMA risk score
79High riskLowerHigher
EarthquakesInland floodingTsunamis
2
federal disasters paid out here

FEMA National Risk Index · OpenFEMA

HousingCost of living grade D−

Homes in Ruston are worth about $748K, by Zillow’s estimate

The typical Ruston home is worth about $748,000, up 4.1% in a year, 27% above the Washington typical home.

$748KZillow home value

Typical home value

Ruston$748K
Washington$588K
+4.1%
value change, 1 year
3
homes sold in April

Zillow Home Value Index · Redfin Data Center

Climate

In Ruston, expect mild winters and pleasant summers

Ruston has mild winters and pleasant summers. Ruston’s July high is 77°F.

77°summer high

Typical low → high °F

Winter36–48°
Spring42–60°
Summer54–75°
Fall45–61°
Nov 21
typical first frost
Mar 11
typical last frost
+1.0°
vs. the 20th-century average
77°
typical summer high

NOAA U.S. Climate Normals, 1991–2020

Work & commuteJobs & income grade A

About one in three of Ruston’s working residents commute to Tacoma

Most working residents leave Ruston for work: only 1% work in town. Since 2013, Ruston has added 153 jobs, to 627 in 2023. The top destinations are Tacoma (34%), Seattle (10%) and Lakewood (6%).

1%work in town
RustonWashington townsU.S. towns
Average trip to work34 minutes27 minutes25 minutes
Median household income$116,000$98,000$80,000
Working residents who work in town0.8%4.9%8%
Below the poverty line7.1%7.9%9.6%

Where working residents work

In Ruston1%
Tacoma34%
Seattle10%
Lakewood6%
Federal Way4%
10 mi
median commute distance
627
jobs based in Ruston
Balanced
jobs vs. working residents
A
Walkability grade: more walkable than 91% of U.S. towns

Census LEHD 2023 · ACS

OutdoorsB

Ruston has set aside 1% of its land for conservation

0.2 miles of trail in 1 park or preserve.

1%conserved
RustonWashington townsU.S. towns
Conserved land1%4%4.3%
Miles of trail per square mile0.7 miles per square mile0.80.4
1%
conserved · 2 of 166 acres
0.2 mi
of trails · 0.7 per sq mi
Biggest places to walkTrailsAcres
1. Rust Park—7

Trails & parks © OpenStreetMap contributors · Conserved land: USGS PAD-US

Keep exploring

Everything we know about Ruston

19pages on Ruston
After high school

Colleges nearby

10 within 15 miles of the center of Ruston

About Ruston

City in Washington, United States

Official town website ↗

Ruston is a city in Pierce County, Washington, United States. The population was 1,055 at the 2020 census. Although it is nearly indistinguishable from the adjacent city of Tacoma, the predominantly residential area still retains its status as a separate municipality long after it ceased to be a company town. The local government opted to reclassify Ruston as a city in late 2012.

From Wikipedia, licensed CC BY-SA 4.0 · facts via Wikidata (CC0)

Area
0.3 sq mi
Elevation
43 ft
Area code
253

Questions about Ruston

Short answers, built from the data on this page.

Is Ruston, WA expensive?

Yes. Cost of living, which also weighs rents, property taxes and how many households pay 30% or more of their income for housing, grades D−.