Guest, Sign inJoin
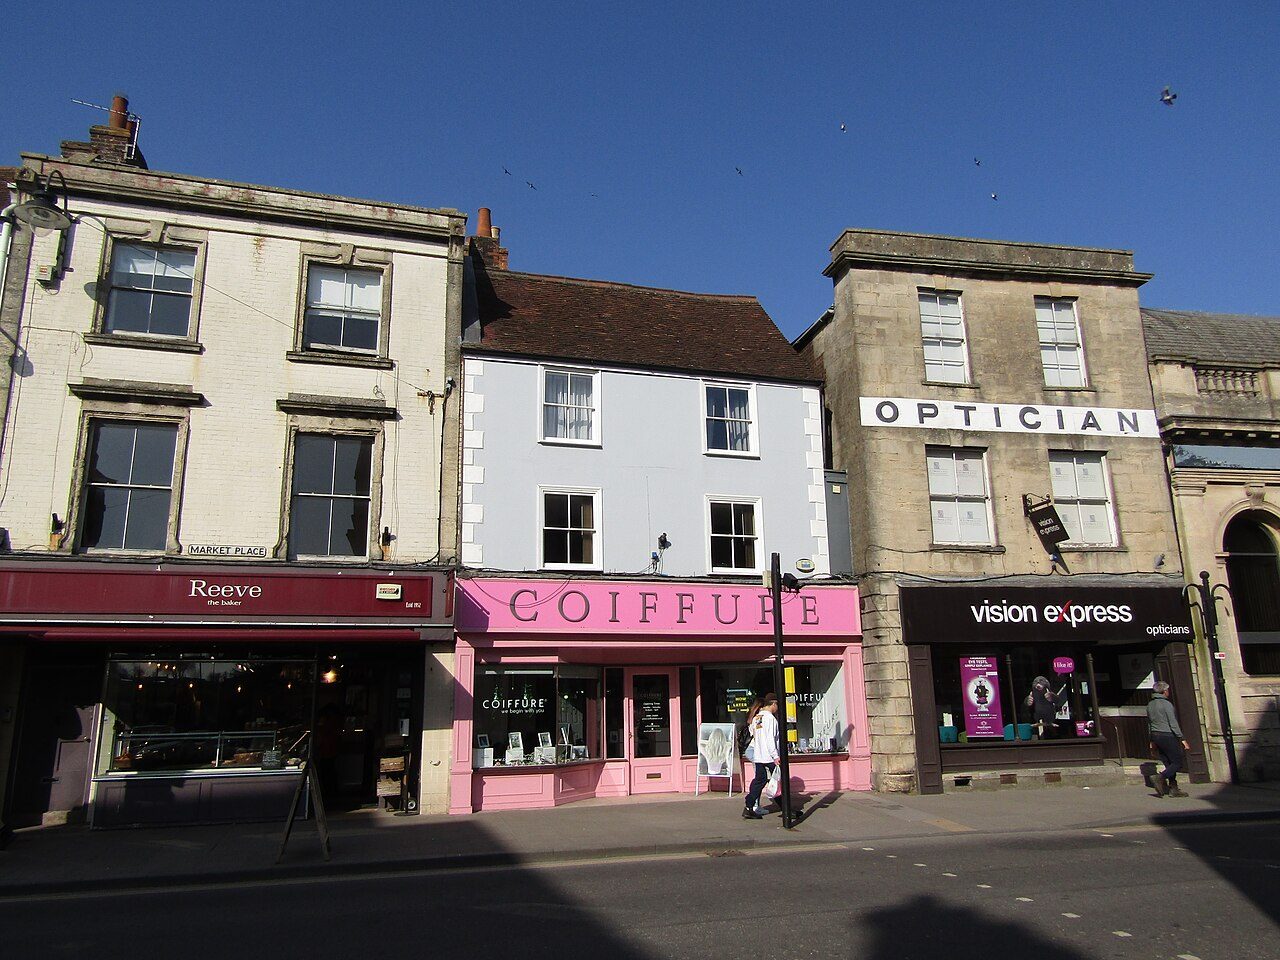
Warminster - Market PlacePhoto: Colin Smith · CC BY-SA 2.0
B+Outdoors Grade
Outdoors in Warminster · parks, paths & countryside

44% of the land within 5 km of Warminster is National Park or National Landscape

The Cranborne Chase & West Wiltshire Downs National Landscape reaches the edge of Warminster. Parks and playing fields in Warminster add up to 1.7 ha for every 1,000 residents; the typical UK town has 2.1. Footpaths add up to 97 km in the town and the kilometre around it, 3.0 for every square kilometre. Warminster grades B+ for the outdoors: #14 of 30 in Wiltshire. A character grade: it isn’t part of the overall grade.

Green space
1.7 ha
per 1,000 residents
Typical UK town 2.1
Near a park
86%
of residents within 400 m
Typical UK town 83%
Footpaths
97 km
3.0 km per km², town + 1 km
Typical UK town 3.0 per km²
Protected landscape
44%
of the land within 5 km
Nearest: Cranborne Chase & West Wiltshire Downs National Landscape
Character

What kind of outdoors town is Warminster?

Read from the data: what stands out first, good and bad.

Warminster’s strongest suit is protected countryside on the doorstep, followed by its views. Where it falls short is park space per person.

Outdoors grade

Warminster grades B+ for the outdoors

Each chart is every UK town of 1,000 or more on one measure: the green bar is Warminster, the dashed line the typical town. The number is the share of towns it beats; the five are averaged and the average ranked again.

B+
Better than 66% of UK towns#14 of 30 in Wiltshire · 26th of 60 UK towns its size
Public green space1.7 haper 1,000 residents: parks, gardens, playing fields, play spaces
typical 2.1 ha010+
34out of
100
A park within a walk86%of residents within 400 m (a 5-minute walk)
typical 83%0100+
58out of
100
National Park or National Landscape44%of the land within 5 km
none100+
90out of
100
Footpaths3.0 kmper km², the town and 1 km around it
typical 3.0 km010+
58out of
100
The sea0%of the area within 5 km · Inland
none80+
42out of
100

Graded, never part of the overall grade (like History and Civic life). It measures what is mapped: OS Open Greenspace leaves out woodland and open-access land that isn’t a park, and OpenStreetMap’s rural paths are more complete in some places than others.

Towns its size

Warminster is 26th of 60 UK towns its size for the outdoors

The 60 UK towns and cities of 16,700 to 19,400 people with an Outdoors Grade. Hover a dot for its figures; tap one for its page.

0255075100Great Wyrley and Cheslyn Hay (Staffordshire): C− · 1.5 ha green space per 1,000 · 60% near a park · 1.6 km path per km²Willerby and Anlaby (East Riding of Yorkshire): C− · 1.6 ha green space per 1,000 · 46% near a park · 1.7 km path per km²Oswestry (Shropshire): C− · 1.3 ha green space per 1,000 · 88% near a park · 2 km path per km²Louth (Lincolnshire): C− · 0.6 ha green space per 1,000 · 76% near a park · 1.3 km path per km²North Hykeham (Lincolnshire): C− · 2.4 ha green space per 1,000 · 60% near a park · 2.3 km path per km²Stone (Staffordshire): C− · 1.5 ha green space per 1,000 · 86% near a park · 2.1 km path per km²Tonypandy (Mid Glamorgan): C · 1.5 ha green space per 1,000 · 85% near a park · 2.5 km path per km²Sleaford (Lincolnshire): C · 1.7 ha green space per 1,000 · 93% near a park · 2 km path per km²Bourne (Lincolnshire): C · 1.3 ha green space per 1,000 · 70% near a park · 4.6 km path per km²Streetly (West Midlands): C · 7.5 ha green space per 1,000 · 58% near a park · 2 km path per km²Nantwich (Cheshire): C · 2.2 ha green space per 1,000 · 86% near a park · 2.3 km path per km²Thornton (Lancashire): C · 2.1 ha green space per 1,000 · 71% near a park · 1.6 km path per km²Bodmin (Cornwall): C+ · 1.1 ha green space per 1,000 · 87% near a park · 2.4 km path per km²Adwick le Street (South Yorkshire): C+ · 2.8 ha green space per 1,000 · 89% near a park · 1.8 km path per km²Knowle and Dorridge (West Midlands): C+ · 2.7 ha green space per 1,000 · 82% near a park · 2.4 km path per km²Royston (Hertfordshire): C+ · 1.3 ha green space per 1,000 · 83% near a park · 4.1 km path per km²Newmarket (Suffolk): C+ · 1.9 ha green space per 1,000 · 91% near a park · 2.6 km path per km²Melksham (Wiltshire): C+ · 2.2 ha green space per 1,000 · 87% near a park · 2.7 km path per km²Maesteg (Mid Glamorgan): C+ · 2 ha green space per 1,000 · 94% near a park · 2.5 km path per km²Rawmarsh (South Yorkshire): C+ · 2 ha green space per 1,000 · 84% near a park · 3.2 km path per km²Ramsbottom (Greater Manchester): C+ · 2.1 ha green space per 1,000 · 74% near a park · 4.1 km path per km²Carterton (Oxfordshire): B− · 2.1 ha green space per 1,000 · 82% near a park · 2 km path per km²Baildon (West Yorkshire): B− · 2 ha green space per 1,000 · 71% near a park · 7.5 km path per km²Guisborough (North Yorkshire): B− · 1.5 ha green space per 1,000 · 80% near a park · 2.6 km path per km²Biddulph (Staffordshire): B− · 3.3 ha green space per 1,000 · 86% near a park · 2.7 km path per km²St Ives (Cambridgeshire): B− · 1.7 ha green space per 1,000 · 95% near a park · 3.7 km path per km²Bramhall (Greater Manchester): B− · 4.7 ha green space per 1,000 · 71% near a park · 3.4 km path per km²Shaw (Greater Manchester): B · 1.9 ha green space per 1,000 · 96% near a park · 3.7 km path per km²Bangor (Gwynedd): B · 0.9 ha green space per 1,000 · 79% near a park · 2.7 km path per km²Ely (Cambridgeshire): B · 2.7 ha green space per 1,000 · 88% near a park · 3.3 km path per km²Cobham (Surrey): B · 3.1 ha green space per 1,000 · 49% near a park · 4 km path per km²Cradley Heath (West Midlands): B · 3.3 ha green space per 1,000 · 76% near a park · 4.3 km path per km²Amersham (Buckinghamshire): B · 1.8 ha green space per 1,000 · 62% near a park · 3.7 km path per km²Liversedge (West Yorkshire): B+ · 2 ha green space per 1,000 · 98% near a park · 4.3 km path per km²Warminster (Wiltshire): B+ · 1.7 ha green space per 1,000 · 86% near a park · 3 km path per km²Swanley (Kent): B+ · 1.8 ha green space per 1,000 · 78% near a park · 4.2 km path per km²Eastwood (Nottinghamshire): B+ · 2.6 ha green space per 1,000 · 93% near a park · 3.9 km path per km²Belper (Derbyshire): B+ · 2.4 ha green space per 1,000 · 94% near a park · 4.1 km path per km²Wombwell (South Yorkshire): B+ · 2.4 ha green space per 1,000 · 92% near a park · 4.5 km path per km²Walkden (Greater Manchester): B+ · 3.4 ha green space per 1,000 · 92% near a park · 3.4 km path per km²Glossop (Derbyshire): B+ · 1.5 ha green space per 1,000 · 78% near a park · 4.2 km path per km²Wath upon Dearne (South Yorkshire): B+ · 5.5 ha green space per 1,000 · 85% near a park · 3.6 km path per km²Alton (Hampshire): B+ · 2.6 ha green space per 1,000 · 82% near a park · 3 km path per km²Euxton (Lancashire): A− · 3.7 ha green space per 1,000 · 98% near a park · 3.5 km path per km²Bredbury and Woodley (Greater Manchester): A · 4.8 ha green space per 1,000 · 94% near a park · 4.8 km path per km²Abbots Langley and Kings Langley (Hertfordshire): A · 3.8 ha green space per 1,000 · 88% near a park · 3.6 km path per km²Clifton (Greater Manchester): A · 10 ha green space per 1,000 · 92% near a park · 4.4 km path per km²Keynsham (Somerset): A · 2.1 ha green space per 1,000 · 95% near a park · 4.6 km path per km²Northwich (Cheshire): A · 8.8 ha green space per 1,000 · 92% near a park · 4.8 km path per km²Forest Town (Nottinghamshire): A · 6.4 ha green space per 1,000 · 94% near a park · 5.7 km path per km²Connah's Quay (Clwyd): A · 5.8 ha green space per 1,000 · 97% near a park · 2.8 km path per km²Shiney Row and Penshaw (Tyne and Wear): A · 9.6 ha green space per 1,000 · 98% near a park · 4.8 km path per km²Waltham Abbey (Essex): A · 11.9 ha green space per 1,000 · 92% near a park · 6.7 km path per km²Colne (Lancashire): A · 3.2 ha green space per 1,000 · 86% near a park · 5.3 km path per km²Brixham (Devon): A · 3.1 ha green space per 1,000 · 76% near a park · 2.5 km path per km²Houghton Regis (Bedfordshire): A · 3.5 ha green space per 1,000 · 81% near a park · 8 km path per km²Litherland (Merseyside): A · 7.3 ha green space per 1,000 · 94% near a park · 3.3 km path per km²Dorking (Surrey): A · 4.4 ha green space per 1,000 · 75% near a park · 7 km path per km²Littlehampton (West Sussex): A+ · 2.1 ha green space per 1,000 · 99% near a park · 3.1 km path per km²Cirencester (Gloucestershire): A+ · 4.3 ha green space per 1,000 · 95% near a park · 4.1 km path per km²Warminster
Outdoors score: the share of UK towns each one beats
Footpath, km per km²
Warminster3.0
Towns its size3.4
Wiltshire towns3.0
All UK towns3.0
Green space, ha per 1,000 residents
Warminster1.7
Towns its size2.3
Wiltshire towns2.0
All UK towns2.1
Residents within 400 m of a park
Warminster86%
Towns its size86%
Wiltshire towns86%
All UK towns83%

Warminster falls furthest behind on park space per resident, where 46 of the 59 others do better.

Show as a table
TownOutdoorsGreen spaceNear a parkPath per km²Protected
1Cirencester GloucestershireA+4.395%4.148%
2Littlehampton West SussexA+2.199%3.118%
3Dorking SurreyA4.475%757%
4Litherland MerseysideA7.394%3.30%
5Houghton Regis BedfordshireA3.581%820%
6Brixham DevonA3.176%2.530%
7Waltham Abbey EssexA11.992%6.70%
8Colne LancashireA3.286%5.38%
9Shiney Row and Penshaw Tyne and WearA9.698%4.80%
10Connah's Quay ClwydA5.897%2.80%
11Forest Town NottinghamshireA6.494%5.70%
12Northwich CheshireA8.892%4.80%
13Keynsham SomersetA2.195%4.611%
14Clifton Greater ManchesterA1092%4.40%
15Abbots Langley and Kings Langley HertfordshireA3.888%3.63%
16Bredbury and Woodley Greater ManchesterA4.894%4.80%
17Euxton LancashireA−3.798%3.50%
18Alton HampshireB+2.682%327%
19Wath upon Dearne South YorkshireB+5.585%3.60%
20Glossop DerbyshireB+1.578%4.260%
21Walkden Greater ManchesterB+3.492%3.40%
22Wombwell South YorkshireB+2.492%4.50%
23Belper DerbyshireB+2.494%4.10%
24Eastwood NottinghamshireB+2.693%3.90%
25Swanley KentB+1.878%4.220%
26Warminster WiltshireB+1.786%344%
27Liversedge West YorkshireB+298%4.30%
28Amersham BuckinghamshireB1.862%3.764%
29Cradley Heath West MidlandsB3.376%4.30%
30Cobham SurreyB3.149%41%
31Ely CambridgeshireB2.788%3.30%
32Bangor GwyneddB0.979%2.711%
33Shaw Greater ManchesterB1.996%3.70%
34Bramhall Greater ManchesterB−4.771%3.40%
35St Ives CambridgeshireB−1.795%3.70%
36Biddulph StaffordshireB−3.386%2.70%
37Guisborough North YorkshireB−1.580%2.635%
38Baildon West YorkshireB−271%7.50%
39Carterton OxfordshireB−2.182%213%
40Ramsbottom Greater ManchesterC+2.174%4.10%
41Rawmarsh South YorkshireC+284%3.20%
42Maesteg Mid GlamorganC+294%2.50%
43Melksham WiltshireC+2.287%2.70%
44Newmarket SuffolkC+1.991%2.60%
45Royston HertfordshireC+1.383%4.10%
46Knowle and Dorridge West MidlandsC+2.782%2.40%
47Adwick le Street South YorkshireC+2.889%1.80%
48Bodmin CornwallC+1.187%2.43%
49Thornton LancashireC2.171%1.60%
50Nantwich CheshireC2.286%2.30%
51Streetly West MidlandsC7.558%20%
52Bourne LincolnshireC1.370%4.60%
53Sleaford LincolnshireC1.793%20%
54Tonypandy Mid GlamorganC1.585%2.50%
55Stone StaffordshireC−1.586%2.10%
56North Hykeham LincolnshireC−2.460%2.30%
57Louth LincolnshireC−0.676%1.347%
58Oswestry ShropshireC−1.388%20%
59Willerby and Anlaby East Riding of YorkshireC−1.646%1.70%
60Great Wyrley and Cheslyn Hay StaffordshireC−1.560%1.63%
The map

Parks, footpaths & countryside

Tap a number to zoom to a park. Tap a layer to hide it. The dashed line is Warminster’s built-up area.

1234
Green space: parks, gardens, playing fields and play spaces, named or not.© OpenStreetMap contributors · Contains OS data © Crown copyright · Natural England / NRW
Places to walk

Parks to walk in, in and around Warminster

The biggest is Portway Field, 6.3 ha (16 acres). Directions go to the park’s nearest public entrance where Ordnance Survey maps one.

All 4 named parks by size: 10 ha (26 acres) and 1 km of pathPortway Field6.3 ha · 0.5 km of pathPortway Field: 6.3 ha, 0.5 km of pathWarminster Communi…2.5 ha · 0.7 km of pathWarminster Community Orchard: 2.5 ha, 0.7 km of pathWarminster…0.9 haWarminster Highbury Youth Football Club: 0.9 haKing George…0.8 haKing George's Field: 0.8 ha
Parks & gardens 2.5 haPlaying fields 7.9 ha

The two biggest, Portway Field and Warminster Community Orchard, are 84% of the named green space.

Warminster’s biggest

Portway Field

Playing field
6.3 ha (16 acres)0.5 km of path
9 pitchesfootball pitches would fit
Centralin the middle of Warminster
Directionsto the nearest entrance

Warminster Community Orchard

Park or garden
2.5 ha (6 acres)0.7 km of path
10 minto walk all 0.7 km of path
3 pitchesfootball pitches would fit
0.9 mi eastfrom the centre
Directionsto the nearest entrance

King George's Field

Playing field
0.8 ha (2 acres)
Centralin the middle of Warminster
Directionsto the park

Warminster Highbury Youth Football Club

Playing field
0.9 ha (2 acres)
0.7 mi eastfrom the centre
Directionsto the nearest entrance
Close to home

9 in 10 Warminster residents live within a 5-minute walk of a park

Each square is 1 in 100 residents: green lives within 400 m of a public park, garden or playing field (Census 2021 output areas against OS Open Greenspace).

Within 400 m (86%)Further (15%)
Warminster86%
Towns its size86%
Wiltshire towns86%
All UK towns83%

About 2,600 people live further than that. Playing fields count, so a park within reach isn’t always one with paths or trees; 16 playgrounds are mapped in and around the town, about one for every 1,126 residents.

National Parks & National Landscapes

National Parks and National Landscapes around Warminster

Protected landscapes within 30 km, by direction and distance from the edge of the built-up area; circle size shows each one’s area. National Landscapes were called Areas of Outstanding Natural Beauty until 2023.

5.3 mi10.5 mi15.8 mi21 miNCranborne Chase & West Wiltshire Downsat the edgeCranborne Chase & West Wiltshire Downs National Landscape: At Warminster’s edge, south · 986 km² · since 1983Cotswolds8.5 mi north-westCotswolds National Landscape: 8.5 mi north-west of Warminster’s edge · 2,041 km² · since 1966North Wessex Downs12 mi north-eastNorth Wessex Downs National Landscape: 12 mi north-east of Warminster’s edge · 1,731 km² · since 1972Mendip Hills15 mi westMendip Hills National Landscape: 15 mi west of Warminster’s edge · 198 km² · since 1989Dorset18 mi southDorset National Landscape: 18 mi south of Warminster’s edge · 1,129 km² · since 1959Warminster
National ParkNational LandscapeThe 5 km the grade counts
National Landscape

Cranborne Chase & West Wiltshire Downs

At the edge south986 km²since 198344% of the land within 5 km
Official site
National Landscape

Cotswolds

8.5 mi north-west2,041 km²since 1966
Official site
National Landscape

North Wessex Downs

12 mi north-east1,731 km²since 1972
Official site
National Landscape

Mendip Hills

15 mi west198 km²since 1989
Official site
National Landscape

Dorset

18 mi south1,129 km²since 1959
Official site

44% of the land within 5 km of Warminster is National Park or National Landscape, more than 89% of UK towns.

Footpaths & waymarked walks

2 waymarked walks pass through or near Warminster

97 km of footpaths, bridleways and rights of way are mapped in Warminster and the kilometre around it, 3.0 km for every square kilometre (the typical UK town has 3.0). Bars show each route’s kilometres within 2 km of the town.

RegionalLocal
Wessex Ridgeway10.5 km
Imber Range Perimeter Path10.5 km

Close to home, the Imber Range Perimeter Path has 11 km of local walk within 2 km of the town. The regional route here is the Wessex Ridgeway.

Waymarked walks are OpenStreetMap walking routes. Public rights of way are only as complete as the map in each area.

History along the way

A registered historic park in Warminster

Historic England’s register of parks and gardens, and the listed buildings and scheduled monuments that stand inside Warminster’s named parks.

Registered · Grade ILongleat0.6 ha

A listed building or monument counts when it sits inside the park’s OS Open Greenspace outline (to about 15 m), so a few at the boundary are included. Historic England, National Heritage List for England.

When to get out

The best walking months in Warminster: May to September

The town’s 1991–2020 averages (Met Office HadUK-Grid) and the daylight at its latitude. Outlined months have 12½+ hours of daylight, highs of 15 °C or more and little rain for the town.

JanFebMarAprMayJunJulAugSepOctNovDec
Daylight (h)8.49.911.713.815.516.516.114.612.510.68.87.9
High (°C)881114172022211915118
Rain (mm)1088170636060687471105118110

May is the driest month (60 mm) and July the warmest (highs of 22 °C). Winter days are short, about 8 hours of daylight in December, and 118 mm of rain falls in November, the wettest month. Frost comes on about 48 nights a year. The climate in Warminster →

Things to do

5 viewpoints and 16 playgrounds

Mapped within 2 km of the town in OpenStreetMap, against the typical UK town its size per resident. Named places are listed with directions; unnamed ones are only counted.

Every named place, with directions

Viewpoints 5

Plus 5 viewpoints without a name on the map.

Hills and peaks 7

Arn Hill Down212 m (696 ft) · 0.3 mi from town
Directions
Battlesbury Hill208 m (682 ft) · 0.4 mi from town
Directions
Cley Hill244 m (801 ft) · 0.7 mi from town
Directions
Little Cley Hill180 m (591 ft) · 0.7 mi from town
Directions
Middle Hill179 m (587 ft) · 0.8 mi from town
Directions
Scratchbury Hill198 m (650 ft) · 1.0 mi from town
Directions

Plus 1 peak without a name on the map.

Nature reserves 1

Smallbrook Meadows6.1 ha · 0.1 mi from town
Directions

Picnic sites 1

Plus 1 picnic site without a name on the map.

Playgrounds 16

Sutton Veny Play Area1.1 mi from town
Directions

Plus 15 playgrounds without a name on the map.

Dog parks 2

Plus 2 dog parks without a name on the map.

Campsites 2

Botany Camping & Glamping0.2 mi from town
Directions
Coopers Bottom0.4 mi from town
Directions
Next door

The outdoors in nearby towns

The nearest towns of 1,000+ within 12 miles. Tap a town for its outdoors page.

ABCDOutdoors Grade
TownOutdoorsGreen space, ha per 1,000Near a parkProtected within 5 km
WarminsterB+1.786%44%
Dilton Marsh 3.3 miB−2.167%4%
Westbury 4.0 miB1.497%1%
Bratton 5.3 miC−1.925%0%
Frome 6.1 miC1.378%9%
Beckington 6.2 miB−2.7100%0%
North Bradley 6.4 miA3.4100%0%

North Bradley, 6.4 miles away, grades A, the best next door: every resident lives within 400 m of a park. North Bradley has at least twice Warminster’s green space per resident.

Questions about the outdoors in Warminster

What is the biggest park in Warminster?

Portway Field, 6.3 ha (16 acres). Warminster Community Orchard (2.5 ha) is second. 4 named parks, gardens and playing fields are in the town or within 400 m of it.

Is Warminster near a National Park?

It covers 986 km² and was designated in 1983.

What are the best walks near Warminster?

2 waymarked walking routes pass within 2 km of the town, including the Wessex Ridgeway and Imber Range Perimeter Path.

How many people in Warminster live near a park?

86% of residents live within 400 m, about a 5-minute walk, of a public park, garden or playing field (Census 2021 output areas against OS Open Greenspace). The typical UK town is 83%.

When is the best time of year for walking in Warminster?

May to September: the longest days, the warmest afternoons and the least rain of the year, from the Met Office 1991–2020 averages.

Which parks in Warminster are historic?

Longleat (Grade I) is on Historic England’s register of parks and gardens.

Is Warminster good for walking?

About average for paths: 3.0 km of footpath and right of way per square kilometre, more than 58% of UK towns. For park space per person it beats 34% (1.7 ha per 1,000 residents).

How is the Outdoors Grade worked out?

From five measures, each placed among UK towns of 1,000 or more: public green space per resident, the share living near a park, National Park or National Landscape within 5 km, footpaths per square kilometre, and the sea within 5 km. It is a character grade and isn’t part of Warminster’s overall grade.

Sources

Where Warminster’s outdoors figures come from

  • Parks and green space: Ordnance Survey OS Open Greenspace (parks and gardens, playing fields, play spaces, and their access points). Contains OS data © Crown copyright and database right 2026, Open Government Licence v3.0.
  • National Parks and National Landscapes: Natural England and Natural Resources Wales boundaries, areas and designation dates, Open Government Licence v3.0.
  • Footpaths, walking routes, beaches and things to do: © OpenStreetMap contributors, Open Database License (ODbL), via Geofabrik, 16 October 2026.
  • Historic parks, listed buildings and monuments: Historic England, National Heritage List for England, Open Government Licence v3.0.
  • Rain and temperature: Met Office HadUK-Grid 1991–2020 averages for the town; daylight calculated from its latitude.
  • The sea: ONS Countries (December 2024) boundaries clipped to mean high water. Residents near a park: ONS Census 2021 output areas.
  • Grade: TownRatings’ Outdoors Grade, ranked against UK towns only.

Contains public sector information licensed under the Open Government Licence v3.0. Contains HM Land Registry data © Crown copyright and database right 2026. Contains OS data © Crown copyright and database right 2026 (ONS boundaries). Northern Ireland: Source: NISRA; contains Land & Property Services data and Ordnance Survey of Northern Ireland information, © Crown copyright, licensed under the Open Government Licence v3.0. Scotland: contains National Records of Scotland data, Registers of Scotland data and SEPA data, © Crown copyright / © SEPA 2025, licensed under the Open Government Licence v3.0.