Guest, Sign inJoin
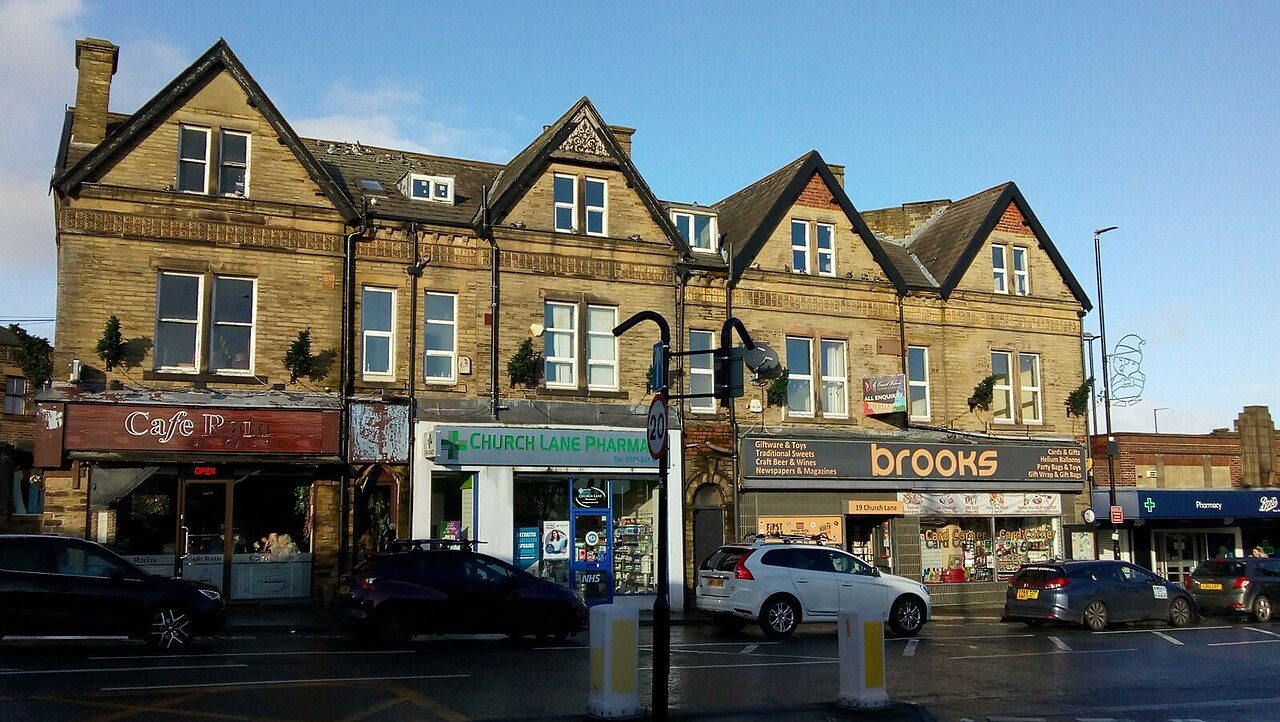
Shops on Church Lane, PudseyPhoto: Stephen Armstrong · CC BY-SA 2.0
B+Outdoors Grade
Outdoors in Pudsey · parks, paths & countryside

Pudsey has more footpath per square kilometre than 9 in 10 UK towns

Footpaths add up to 150 km in the town and the kilometre around it, 5.1 for every square kilometre. 94% of residents live within a 5-minute walk of a park or playing field. Parks and playing fields in Pudsey add up to 1.9 ha for every 1,000 residents; the typical UK town has 2.1. Pudsey grades B+ for the outdoors: #26 of 91 in West Yorkshire. A character grade: it isn’t part of the overall grade.

Green space
1.9 ha
per 1,000 residents
Typical UK town 2.1
Near a park
94%
of residents within 400 m
Typical UK town 83%
Footpaths
150 km
5.1 km per km², town + 1 km
Typical UK town 3.0 per km²
Protected landscape
0%
of the land within 5 km
Nearest: Nidderdale National Landscape
Character

What kind of outdoors town is Pudsey?

Read from the data: what stands out first, good and bad.

Pudsey’s strongest suit is dense footpaths, followed by its historic parks.

Outdoors grade

Pudsey grades B+ for the outdoors

Each chart is every UK town of 1,000 or more on one measure: the green bar is Pudsey, the dashed line the typical town. The number is the share of towns it beats; the five are averaged and the average ranked again.

B+
Better than 67% of UK towns#26 of 91 in West Yorkshire · 26th of 60 UK towns its size
Public green space1.9 haper 1,000 residents: parks, gardens, playing fields, play spaces
typical 2.1 ha010+
43out of
100
A park within a walk94%of residents within 400 m (a 5-minute walk)
typical 83%0100+
74out of
100
National Park or National Landscape0%of the land within 5 km · None within 5 km
none100+
31out of
100
Footpaths5.1 kmper km², the town and 1 km around it
typical 3.0 km010+
94out of
100
The sea0%of the area within 5 km · Inland
none80+
42out of
100

Graded, never part of the overall grade (like History and Civic life). It measures what is mapped: OS Open Greenspace leaves out woodland and open-access land that isn’t a park, and OpenStreetMap’s rural paths are more complete in some places than others.

Towns its size

Pudsey is 26th of 60 UK towns its size for the outdoors

The 60 UK towns and cities of 31,900 to 38,100 people with an Outdoors Grade. Hover a dot for its figures; tap one for its page.

0255075100Bromsgrove (Worcestershire): C− · 1.4 ha green space per 1,000 · 75% near a park · 2.6 km path per km²Bilston (West Midlands): C− · 1.5 ha green space per 1,000 · 76% near a park · 2.9 km path per km²Bridlington (East Riding of Yorkshire): C · 0.8 ha green space per 1,000 · 80% near a park · 1.8 km path per km²Sedgley (West Midlands): C · 1.5 ha green space per 1,000 · 65% near a park · 4 km path per km²Rayleigh (Essex): C · 2 ha green space per 1,000 · 71% near a park · 3.1 km path per km²Long Eaton (Derbyshire): C · 1.8 ha green space per 1,000 · 74% near a park · 3.6 km path per km²Horndean (Hampshire): C+ · 0.9 ha green space per 1,000 · 57% near a park · 3.3 km path per km²Morley (West Yorkshire): C+ · 1.2 ha green space per 1,000 · 87% near a park · 3.9 km path per km²New Haw, West Byfleet and Sheerwater (Surrey): C+ · 2.2 ha green space per 1,000 · 69% near a park · 4.1 km path per km²Pontefract (West Yorkshire): C+ · 2.6 ha green space per 1,000 · 84% near a park · 2.6 km path per km²Winsford (Cheshire): C+ · 1.3 ha green space per 1,000 · 92% near a park · 3.9 km path per km²Billericay (Essex): C+ · 4.1 ha green space per 1,000 · 70% near a park · 3 km path per km²Camberley (Surrey): C+ · 2 ha green space per 1,000 · 73% near a park · 4.8 km path per km²Whitstable (Kent): B− · 1.5 ha green space per 1,000 · 84% near a park · 2.3 km path per km²Tonbridge (Kent): B− · 2.1 ha green space per 1,000 · 65% near a park · 2.6 km path per km²Canvey Island (Essex): B− · 1.5 ha green space per 1,000 · 86% near a park · 2.3 km path per km²Redcar (North Yorkshire): B− · 2.6 ha green space per 1,000 · 79% near a park · 1.9 km path per km²Morecambe (Lancashire): B− · 0.8 ha green space per 1,000 · 84% near a park · 2.2 km path per km²Caerphilly (Gwent): B · 2.6 ha green space per 1,000 · 82% near a park · 3.8 km path per km²Chadderton (Greater Manchester): B · 1.9 ha green space per 1,000 · 87% near a park · 4.6 km path per km²Bicester (Oxfordshire): B · 2.1 ha green space per 1,000 · 99% near a park · 3.2 km path per km²Abingdon-on-Thames (Oxfordshire): B · 2.1 ha green space per 1,000 · 91% near a park · 3.9 km path per km²Letchworth (Hertfordshire): B · 2.2 ha green space per 1,000 · 85% near a park · 4.8 km path per km²Loughton (Essex): B · 2.9 ha green space per 1,000 · 74% near a park · 5.5 km path per km²Denton (Greater Manchester): B · 2.4 ha green space per 1,000 · 88% near a park · 4.2 km path per km²Warwick (Warwickshire): B · 3 ha green space per 1,000 · 85% near a park · 3.8 km path per km²Whitley Bay (Tyne and Wear): B · 1.9 ha green space per 1,000 · 82% near a park · 2.9 km path per km²Billingham (County Durham): B · 4.7 ha green space per 1,000 · 86% near a park · 2.9 km path per km²Wigston (Leicestershire): B · 2.9 ha green space per 1,000 · 88% near a park · 3.6 km path per km²Brighouse (West Yorkshire): B · 2.5 ha green space per 1,000 · 91% near a park · 3.8 km path per km²West Bridgford (Nottinghamshire): B+ · 2.2 ha green space per 1,000 · 86% near a park · 7.7 km path per km²Hitchin (Hertfordshire): B+ · 1.5 ha green space per 1,000 · 83% near a park · 4.4 km path per km²Aberdare (Mid Glamorgan): B+ · 4.6 ha green space per 1,000 · 84% near a park · 1.8 km path per km²Hucknall (Nottinghamshire): B+ · 3 ha green space per 1,000 · 87% near a park · 4 km path per km²Pudsey (West Yorkshire): B+ · 1.9 ha green space per 1,000 · 94% near a park · 5.1 km path per km²Brierley Hill (West Midlands): B+ · 3.1 ha green space per 1,000 · 82% near a park · 4.6 km path per km²Lichfield (Staffordshire): B+ · 2.7 ha green space per 1,000 · 82% near a park · 3.1 km path per km²Fleet (Hampshire): B+ · 3.3 ha green space per 1,000 · 79% near a park · 5.5 km path per km²Swadlincote (Derbyshire): B+ · 4.1 ha green space per 1,000 · 84% near a park · 3.8 km path per km²Fulwood (Lancashire): B+ · 3.5 ha green space per 1,000 · 87% near a park · 3.9 km path per km²Chippenham (Wiltshire): B+ · 2.8 ha green space per 1,000 · 76% near a park · 3.9 km path per km²Waterlooville (Hampshire): B+ · 1 ha green space per 1,000 · 66% near a park · 5.2 km path per km²Exmouth (Devon): A− · 1.4 ha green space per 1,000 · 82% near a park · 2.6 km path per km²Didcot (Oxfordshire): A− · 1.6 ha green space per 1,000 · 88% near a park · 3.8 km path per km²St Neots (Cambridgeshire): A− · 3.5 ha green space per 1,000 · 91% near a park · 4.4 km path per km²Nelson (Lancashire): A− · 1.8 ha green space per 1,000 · 85% near a park · 5.2 km path per km²Accrington (Lancashire): A− · 2.6 ha green space per 1,000 · 79% near a park · 5.6 km path per km²Sutton in Ashfield (Nottinghamshire): A− · 4.3 ha green space per 1,000 · 94% near a park · 4 km path per km²Caversham (Berkshire): A− · 2.5 ha green space per 1,000 · 77% near a park · 4.3 km path per km²Dunstable (Bedfordshire): A− · 2 ha green space per 1,000 · 78% near a park · 8 km path per km²Chandler's Ford (Hampshire): A− · 2.7 ha green space per 1,000 · 80% near a park · 5.3 km path per km²Rustington (West Sussex): A− · 2.1 ha green space per 1,000 · 78% near a park · 2.7 km path per km²Redhill (Surrey): A− · 2.2 ha green space per 1,000 · 91% near a park · 4.3 km path per km²Skelmersdale (Lancashire): A · 7.8 ha green space per 1,000 · 91% near a park · 5.4 km path per km²Burgess Hill (West Sussex): A · 2.4 ha green space per 1,000 · 87% near a park · 5 km path per km²Epsom (Surrey): A · 5.7 ha green space per 1,000 · 80% near a park · 4.8 km path per km²Hyde (Greater Manchester): A · 4.3 ha green space per 1,000 · 91% near a park · 3.9 km path per km²Dover (Kent): A+ · 3 ha green space per 1,000 · 86% near a park · 2.9 km path per km²Great Malvern (Worcestershire): A+ · 3.9 ha green space per 1,000 · 90% near a park · 6 km path per km²Locks Heath (Hampshire): A+ · 3.5 ha green space per 1,000 · 91% near a park · 3.7 km path per km²Pudsey
Outdoors score: the share of UK towns each one beats
Footpath, km per km²
Pudsey5.1
Towns its size3.9
West Yorkshire towns3.5
All UK towns3.0
Green space, ha per 1,000 residents
Pudsey1.9
Towns its size2.3
West Yorkshire towns2.1
All UK towns2.1
Residents within 400 m of a park
Pudsey94%
Towns its size84%
West Yorkshire towns87%
All UK towns83%

Against towns its size, Pudsey stands out most for path per km²: only 10 of the other 59 have more. It falls furthest behind on park space per resident, where 41 of the others do better.

Show as a table
TownOutdoorsGreen spaceNear a parkPath per km²Protected
1Locks Heath HampshireA+3.591%3.74%
2Great Malvern WorcestershireA+3.990%638%
3Dover KentA+386%2.929%
4Hyde Greater ManchesterA4.391%3.91%
5Epsom SurreyA5.780%4.82%
6Burgess Hill West SussexA2.487%527%
7Skelmersdale LancashireA7.891%5.40%
8Redhill SurreyA−2.291%4.314%
9Rustington West SussexA−2.178%2.725%
10Chandler's Ford HampshireA−2.780%5.36%
11Dunstable BedfordshireA−278%829%
12Sutton in Ashfield NottinghamshireA−4.394%40%
13Caversham BerkshireA−2.577%4.332%
14Accrington LancashireA−2.679%5.60%
15Nelson LancashireA−1.885%5.215%
16St Neots CambridgeshireA−3.591%4.40%
17Didcot OxfordshireA−1.688%3.839%
18Exmouth DevonA−1.482%2.621%
19Waterlooville HampshireB+166%5.218%
20Chippenham WiltshireB+2.876%3.97%
21Fulwood LancashireB+3.587%3.90%
22Swadlincote DerbyshireB+4.184%3.80%
23Fleet HampshireB+3.379%5.50%
24Lichfield StaffordshireB+2.782%3.12%
25Brierley Hill West MidlandsB+3.182%4.60%
26Pudsey West YorkshireB+1.994%5.10%
27Hucknall NottinghamshireB+387%40%
28Aberdare Mid GlamorganB+4.684%1.819%
29Hitchin HertfordshireB+1.583%4.410%
30West Bridgford NottinghamshireB+2.286%7.70%
31Brighouse West YorkshireB2.591%3.80%
32Wigston LeicestershireB2.988%3.60%
33Billingham County DurhamB4.786%2.90%
34Whitley Bay Tyne and WearB1.982%2.90%
35Warwick WarwickshireB385%3.80%
36Denton Greater ManchesterB2.488%4.20%
37Letchworth HertfordshireB2.285%4.80%
38Loughton EssexB2.974%5.50%
39Abingdon-on-Thames OxfordshireB2.191%3.90%
40Bicester OxfordshireB2.199%3.20%
41Caerphilly GwentB2.682%3.80%
42Chadderton Greater ManchesterB1.987%4.60%
43Morecambe LancashireB−0.884%2.22%
44Redcar North YorkshireB−2.679%1.90%
45Canvey Island EssexB−1.586%2.30%
46Tonbridge KentB−2.165%2.638%
47Whitstable KentB−1.584%2.30%
48Camberley SurreyC+273%4.80%
49Billericay EssexC+4.170%30%
50Winsford CheshireC+1.392%3.90%
51Pontefract West YorkshireC+2.684%2.60%
52New Haw, West Byfleet and Sheerwater SurreyC+2.269%4.10%
53Morley West YorkshireC+1.287%3.90%
54Horndean HampshireC+0.957%3.353%
55Long Eaton DerbyshireC1.874%3.60%
56Rayleigh EssexC271%3.10%
57Sedgley West MidlandsC1.565%40%
58Bridlington East Riding of YorkshireC0.880%1.80%
59Bilston West MidlandsC−1.576%2.90%
60Bromsgrove WorcestershireC−1.475%2.60%
The map

Parks, footpaths & countryside

Tap a number to zoom to a park. Tap a layer to hide it. The dashed line is Pudsey’s built-up area.

12345678
Green space: parks, gardens, playing fields and play spaces, named or not.© OpenStreetMap contributors · Contains OS data © Crown copyright · Natural England / NRW
Places to walk

Parks to walk in, in and around Pudsey

The biggest is Stanningley Park, 10 ha (26 acres). Directions go to the park’s nearest public entrance where Ordnance Survey maps one.

All 12 named parks by size: 43 ha (105 acres) and 10 km of pathStanningley Park10 ha · 2.2 km of pathStanningley Park: 10 ha, 2.2 km of pathQueen's Park7.6 ha · 1.1 km of pathQueen's Park: 7.6 ha, 1.1 km of pathWood Nook5.8 ha · 1.8 km of pathWood Nook: 5.8 ha, 1.8 km of pathRodley Recre…4.0 ha · 1.6 km…Rodley Recreation Ground: 4.0 ha, 1.6 km of pathPudsey Park3.3 ha · 1.6 km…Pudsey Park: 3.3 ha, 1.6 km of pathWestroyd Park3.2 ha · 0.7 km…Westroyd Park: 3.2 ha, 0.7 km of path2 haArthur Miller Stadium: 1.9 haHainsworth…1.9 ha · 0.5 k…Hainsworth Playing Fields: 1.9 ha, 0.5 km of pathBrookfield…1.9 ha · 0.5 k…Brookfield Recreation Ground: 1.9 ha, 0.5 km of path1 haPudsey St Lawrence Cricket Club: 1.3 ha1 haRed Lane Ground: 1.3 ha, 0.1 km of pathMarsden Memorial Gardens: 0.0 ha
Parks & gardens 23 haPlaying fields 20 ha

The biggest is Stanningley Park, 10 ha (26 acres); no single park dominates. 6 of the 12 are under 2 ha: small gardens, play spaces and pitches.

Pudsey’s biggest

Stanningley Park

Park or garden · 180 m outside town
10 ha (26 acres)2.2 km of path
30 minto walk all 2.2 km of path
15 pitchesfootball pitches would fit
0.9 mi north-eastfrom the centre
Directionsto the nearest entrance

Wood Nook

Park or garden
5.8 ha (14 acres)1.8 km of path
25 minto walk all 1.8 km of path
8 pitchesfootball pitches would fit
Centralin the middle of Pudsey
Definitive Footpath PUDSEY 43Owlcotes Lane
Directionsto the nearest entrance

Queen's Park

Playing field
7.6 ha (19 acres)1.1 km of path
15 minto walk all 1.1 km of path
11 pitchesfootball pitches would fit
Centralin the middle of Pudsey
Directionsto the nearest entrance

Pudsey Park

Park or garden
3.3 ha (8 acres)1.6 km of path
20 minto walk all 1.6 km of path
5 pitchesfootball pitches would fit
0.4 mi south-eastfrom the centre
Directionsto the nearest entrance

Rodley Recreation Ground

Playing field · 280 m outside town
4.0 ha (10 acres)1.6 km of path
20 minto walk all 1.6 km of path
6 pitchesfootball pitches would fit
1.5 mi north-eastfrom the centre
Definitive Footpath LEEDS 37Definitive Footpath LEEDS 265
Directionsto the nearest entrance

Westroyd Park

Park or garden
3.2 ha (8 acres)0.7 km of path
10 minto walk all 0.7 km of path
4 pitchesfootball pitches would fit
0.5 mi northfrom the centre
Directionsto the nearest entrance

Hainsworth Playing Fields

Playing field
1.9 ha (5 acres)0.5 km of path
3 pitchesfootball pitches would fit
0.7 mi northfrom the centre
Definitive Footpath PUDSEY 29
Directionsto the nearest entrance

Brookfield Recreation Ground

Playing field · 310 m outside town
1.9 ha (5 acres)0.5 km of path
3 pitchesfootball pitches would fit
1.6 mi northfrom the centre
Directionsto the nearest entrance
All 12 named parks and green spaces
Stanningley ParkPark or garden · 10 ha · 2.2 km of path · just outside town
Directions
Wood NookPark or garden · 5.8 ha · 1.8 km of path
Directions
Queen's ParkPlaying field · 7.6 ha · 1.1 km of path
Directions
Pudsey ParkPark or garden · 3.3 ha · 1.6 km of path
Directions
Rodley Recreation GroundPlaying field · 4.0 ha · 1.6 km of path · just outside town
Directions
Westroyd ParkPark or garden · 3.2 ha · 0.7 km of path
Directions
Hainsworth Playing FieldsPlaying field · 1.9 ha · 0.5 km of path
Directions
Brookfield Recreation GroundPlaying field · 1.9 ha · 0.5 km of path · just outside town
Directions
Arthur Miller StadiumPlaying field · 1.9 ha · just outside town
Directions
Red Lane GroundPlaying field · 1.3 ha · 0.1 km of path
Directions
Pudsey St Lawrence Cricket ClubPlaying field · 1.3 ha
Directions
Marsden Memorial GardensPark or garden · 0.0 ha
Directions
Close to home

9 in 10 Pudsey residents live within a 5-minute walk of a park

Each square is 1 in 100 residents: green lives within 400 m of a public park, garden or playing field (Census 2021 output areas against OS Open Greenspace).

Within 400 m (94%)Further (6%)
Pudsey94%
Towns its size84%
West Yorkshire towns87%
All UK towns83%

About 2,000 people live further than that. Playing fields count, so a park within reach isn’t always one with paths or trees; 50 playgrounds are mapped in and around the town, about one for every 697 residents.

National Parks & National Landscapes

The Nidderdale National Landscape is 6.3 mi away

Protected landscapes within 30 km, by direction and distance from the edge of the built-up area; circle size shows each one’s area. National Landscapes were called Areas of Outstanding Natural Beauty until 2023.

4.5 mi9 mi13.5 mi18 miNNidderdale6.3 mi northNidderdale National Landscape: 6.3 mi north of Pudsey’s edge · 601 km² · since 1994Yorkshire Dales12 mi north-westYorkshire Dales National Park: 12 mi north-west of Pudsey’s edge · 2,185 km² · since 1954Peak District15 mi south-westPeak District National Park: 15 mi south-west of Pudsey’s edge · 1,438 km² · since 1951Pudsey
National ParkNational LandscapeThe 5 km the grade counts
National Landscape

Nidderdale

6.3 mi north601 km²since 1994
Official site
National Park

Yorkshire Dales

12 mi north-west2,185 km²since 1954
Official site
National Park

Peak District

15 mi south-west1,438 km²since 1951
Official site

Yorkshire Dales National Park covers 2,185 km² and has been a National Park since 1954.

Footpaths & waymarked walks

4 waymarked walks pass through or near Pudsey

150 km of footpaths, bridleways and rights of way are mapped in Pudsey and the kilometre around it, 5.1 km for every square kilometre (the typical UK town has 3.0). Bars show each route’s kilometres within 2 km of the town.

RegionalLocal
Leeds Country Way15.1 km
Calverley Millenium Way9.7 km
Airedale Way3.7 km
Pudsey Link Bridleway2.1 km

Close to home, the Leeds Country Way has 15 km of local walk within 2 km of the town. The regional route here is the Airedale Way.

Waymarked walks are OpenStreetMap walking routes. Public rights of way are only as complete as the map in each area.

History along the way

A registered historic park in Pudsey

Historic England’s register of parks and gardens, and the listed buildings and scheduled monuments that stand inside Pudsey’s named parks.

Registered · Grade II*Pudsey Cemetery4.5 ha

A listed building or monument counts when it sits inside the park’s OS Open Greenspace outline (to about 15 m), so a few at the boundary are included. Historic England, National Heritage List for England.

When to get out

The best walking months in Pudsey: May to September

The town’s 1991–2020 averages (Met Office HadUK-Grid) and the daylight at its latitude. Outlined months have 12½+ hours of daylight, highs of 15 °C or more and little rain for the town.

JanFebMarAprMayJunJulAugSepOctNovDec
Daylight (h)8.09.711.713.915.917.116.614.812.610.48.47.4
High (°C)7791216182020171397
Rain (mm)756761585573647170818489

May is the driest month (55 mm) and July the warmest (highs of 20 °C). Winter days are short, about 7 hours of daylight in December, and 89 mm of rain falls in December, the wettest month. Frost comes on about 40 nights a year. The climate in Pudsey →

Things to do

50 playgrounds and the nearest beaches

Mapped within 2 km of the town in OpenStreetMap, against the typical UK town its size per resident. Named places are listed with directions; unnamed ones are only counted.

The nearest beaches

Pudsey is inland. These are the nearest named beaches, measured from the edge of the town.

Treasure Beach19 mi from Pudsey’s edge
Directions
Pebble Beach24 mi from Pudsey’s edge
Directions
York Beach25 mi from Pudsey’s edge
Directions
Doncaster Lakeside Beach29 mi from Pudsey’s edge
Directions
Beach at Doncaster Lakeside29 mi from Pudsey’s edge
Directions
Good to know

Check the water before you swim. The Environment Agency tests designated bathing waters from May to September and publishes a rating for each beach.

Every named place, with directions

Viewpoints 1

Plus 1 viewpoint without a name on the map.

Hills and peaks 2

Beecroft Hill0.6 mi from town
Directions
Round Hill0.6 mi from town
Directions

Nature reserves 2

Rodley Nature Reserve31 ha · 0.7 mi from town
Directions
Farnley Hall Fish Pond Local Nature Reserve1.5 ha · 0.8 mi from town
Directions

Picnic sites 7

Calverley Lane Picnic Area0.6 mi from town
Directions

Plus 6 picnic sites without a name on the map.

Playgrounds 50

Little Burrowersin town
Directions
Beech Grove Park play area1.1 mi from town
Directions
Kids Clubhouse1.2 mi from town
Directions

Plus 47 playgrounds without a name on the map.

Dog parks 1

The Pudsey Dog Parkin town
Directions
Next door

The outdoors in nearby towns

The nearest towns of 1,000+ within 12 miles. Tap a town for its outdoors page.

ABCDOutdoors Grade
TownOutdoorsGreen space, ha per 1,000Near a parkProtected within 5 km
PudseyB+1.994%0%
Calverley 2.0 miB1.592%0%
Drighlington 3.2 miB+4.192%0%
Gildersome 3.2 miC−1.281%0%
Rawdon 3.6 miC+1.767%0%
Bradford 3.7 miC+1.488%0%
Gomersal and Birkenshaw 4.0 miB3.283%0%

Drighlington, 3.2 miles away, grades B+, the best next door: 92% of its residents live within 400 m of a park. Drighlington has at least twice Pudsey’s green space per resident. None of the neighbours has a protected landscape within 5 km either.

Questions about the outdoors in Pudsey

What is the biggest park in Pudsey?

Stanningley Park, 10 ha (26 acres), with 2.2 km of path, just outside the built-up area. Wood Nook (5.8 ha) is second. 12 named parks, gardens and playing fields are in the town or within 400 m of it.

Is Pudsey near a National Park?

Yes. Yorkshire Dales National Park begins 12 mi north-west of the town’s edge. It covers 2,185 km² and has been a National Park since 1954. The nearest protected landscape of any kind is the Nidderdale National Landscape, 6.3 mi away.

What are the best walks near Pudsey?

4 waymarked walking routes pass within 2 km of the town, including the Leeds Country Way, Calverley Millenium Way and Airedale Way. Stanningley Park alone has 2.2 km of path.

What is the nearest beach to Pudsey?

Treasure Beach, 19 mi from the edge of the town, then Pebble Beach (24 mi). Pudsey itself is inland.

How many people in Pudsey live near a park?

94% of residents live within 400 m, about a 5-minute walk, of a public park, garden or playing field (Census 2021 output areas against OS Open Greenspace). The typical UK town is 83%.

When is the best time of year for walking in Pudsey?

May to September: the longest days, the warmest afternoons and the least rain of the year, from the Met Office 1991–2020 averages.

Which parks in Pudsey are historic?

Pudsey Cemetery (Grade II*) is on Historic England’s register of parks and gardens.

Is Pudsey good for walking?

For paths, yes: 5.1 km of footpath and right of way per square kilometre, more than 94% of UK towns. For park space per person it beats 43% (1.9 ha per 1,000 residents).

How is the Outdoors Grade worked out?

From five measures, each placed among UK towns of 1,000 or more: public green space per resident, the share living near a park, National Park or National Landscape within 5 km, footpaths per square kilometre, and the sea within 5 km. It is a character grade and isn’t part of Pudsey’s overall grade.

Sources

Where Pudsey’s outdoors figures come from

  • Parks and green space: Ordnance Survey OS Open Greenspace (parks and gardens, playing fields, play spaces, and their access points). Contains OS data © Crown copyright and database right 2026, Open Government Licence v3.0.
  • National Parks and National Landscapes: Natural England and Natural Resources Wales boundaries, areas and designation dates, Open Government Licence v3.0.
  • Footpaths, walking routes, beaches and things to do: © OpenStreetMap contributors, Open Database License (ODbL), via Geofabrik, 16 October 2026.
  • Historic parks, listed buildings and monuments: Historic England, National Heritage List for England, Open Government Licence v3.0.
  • Rain and temperature: Met Office HadUK-Grid 1991–2020 averages for the town; daylight calculated from its latitude.
  • The sea: ONS Countries (December 2024) boundaries clipped to mean high water. Residents near a park: ONS Census 2021 output areas.
  • Grade: TownRatings’ Outdoors Grade, ranked against UK towns only.

Contains public sector information licensed under the Open Government Licence v3.0. Contains HM Land Registry data © Crown copyright and database right 2026. Contains OS data © Crown copyright and database right 2026 (ONS boundaries). Northern Ireland: Source: NISRA; contains Land & Property Services data and Ordnance Survey of Northern Ireland information, © Crown copyright, licensed under the Open Government Licence v3.0. Scotland: contains National Records of Scotland data, Registers of Scotland data and SEPA data, © Crown copyright / © SEPA 2025, licensed under the Open Government Licence v3.0.