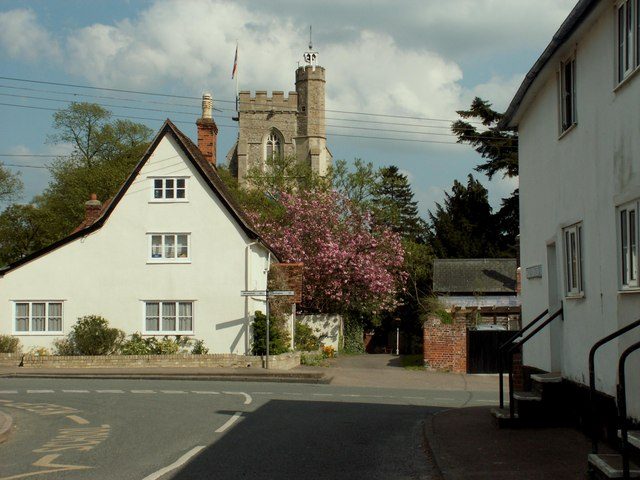
 Photo: Robert Edwards · CC BY-SA 2.0
Hundon has fewer jobs than residents in work: 0.4 for each
For 15% of residents who travel to work, the journey is under 3 miles. 169 residents leave for work each working day, and 15 people travel in. Hundon isn’t graded for jobs and income.
The work figures that set Hundon apart
Longer journeys to work
Against 45% across England’s towns. 3% of commuters walk to work (11% across England’s towns). Getting to work ↓
Fewer benefit claims than most towns
The typical UK town: 2.7%; England and Wales: 4% so far in 2026. Claims across the West Suffolk council area have run below the national rate every month since 2015. Benefits over time ↓
Written from the data on this page: ONS Census 2021 and BRES, DWP claimant counts via Nomis, and ONS household income.
How Hundon gets to work: 6% without a car
Median journey 11 km; typical UK town 8.4 km.
ONS Census 2021, TS061 (method of travel) and TS058 (distance, straight line from home to workplace), output areas summed. Census day fell in the third lockdown, so fewer people travelled than usual.
How residents who travel to work get there, and how far they go (Census 2021, not counting those working mainly at home).
Jobless claims in the West Suffolk council area have run below England and Wales every month since 2015
West Suffolk’s rate was about 1.6% in 2019, peaked at 4.3% in May 2020 and has averaged 2.5% in 2026, against 4% across England and Wales. Claims everywhere stay higher than before the pandemic, partly because Universal Credit counts more people on low pay as looking for work.
The chart is the whole council area of West Suffolk, which Nomis publishes monthly; the figures above the line are for Hundon’s built-up area. Claimant count: people claiming Jobseeker’s Allowance, or Universal Credit while required to look for work. Employment deprivation counts people out of work on Jobseeker’s Allowance, Employment and Support Allowance, Incapacity Benefit, Severe Disablement Allowance, Carer’s Allowance or the Universal Credit equivalents (English Indices of Deprivation 2025). The “most deprived tenth” compares areas within England only.
Claimant rate since 2015: people claiming Jobseeker’s Allowance or Universal Credit while looking for work, as a share of residents aged 16 to 64 (DWP, via Nomis).
Each working day, more people leave Hundon for work than come in
355 residents were in work at the 2021 Census; 201 people worked in Hundon.
For every person who comes in to work, about 11 residents travel out. 3% of residents who travel to a workplace stay in the village; in the typical UK town of 2,500+ it’s 14%.
The middle of each bar is the same people: residents who work in the village or from home.
Hundon’s commuters work from Haverhill to Bury St Edmunds
- Sudbury6
- Bury St Edmunds3
- Red Lodge2
- Countryside2
- Radwinter1
- Chevington1
- Haverhill48
- Bury St Edmunds24
- Countryside23
- Cock and End11
- Newmarket8
- Cambridge7
- Clare3
- Long Melford3
- Great Dunmow2
- Braintree2
97% of residents who travel to a workplace work outside Hundon; Haverhill takes the most (48). Coming the other way, Sudbury sends the most (6).
The ten places that send the most workers into Hundon, and the ten where its residents most often work (Census 2021, by home and workplace). Line width is the number of people.
130 jobs, 28% in public administration and defence
BRES counts jobs, not people (a part-time job and a second job count once each), so it runs above the Census count of people working here (201). Small areas are shared out to the town by where their Census 2021 workers were based; kinds of work are BRES industry divisions (SIC 2007), rounded. England’s towns: all jobs in its built-up areas.
Jobs at workplaces in Hundon (employees and working owners, ONS Business Register and Employment Survey 2024).
Income in Hundon: £59,790 per household a year
Higher than 70% of UK towns of 2,500+; the typical town is £52,385. The whole council area of West Suffolk averages £55,216.
The town figure is ONS’s neighbourhood (MSOA) estimates shared out by where the town’s residents live.
Total household income before tax, mean, year to March 2023 (ONS small-area estimates).
38% of Hundon’s adults have retired
ONS Census 2021, tables TS066 (economic activity) and TS063 (occupation), output areas summed to the built-up area. England’s towns: everyone living in its built-up areas.
Everyone 16 and over, by what they were doing the week before the 2021 Census, and the jobs of those in work.
The places around Hundon, side by side
| Town | People | Jobs | Work in own town | Claimants | Grade |
|---|---|---|---|---|---|
| Hundon | 816 | 130 | 3% | 2.2% | — |
| Cock and End | 1,346 | 600 | 79% | 1% | A− |
| Kedington | 1,778 | 270 | 1% | 1.6% | B+ |
| Clare | 2,278 | 500 | 15% | 2.9% | C |
| Haverhill | 26,704 | 9,580 | 41% | 3.7% | C |
| Steeple Bumpstead | 1,376 | 342 | 3% | 1.9% | B |
| Glemsford | 3,693 | 534 | 7% | 3.2% | C |
| Great Yeldham | 1,824 | 225 | 4% | 2.3% | C+ |
Jobs based in each place, commuters who stay in their own town, and the claimant rate.
What this data can and can’t tell you
- The Census was taken in lockdown. Census day was 21 March 2021, during the third national lockdown: many people were furloughed or working from home, so fewer travelled to work, and journeys were shorter, than before the pandemic or since. The flows on this page show where people worked that spring.
- At home and no fixed place are one figure. In the workplace flows, ONS puts people who mainly worked at home and people with no fixed workplace (drivers, builders, care workers on rounds) at their home address, so the two can’t be told apart there.
- Towns are built-up areas. Hundon here is ONS’s built-up area: the town as built, not its council district. A workplace on an estate or farm outside every built-up area counts as “outside any built-up area”.
- Jobs are counted where they are. BRES counts jobs at each workplace (employees and working owners, rounded by ONS), so a town with a hospital, university or big employer can have more jobs than working residents. Small areas are shared out to towns by where their Census workers were based.
- The benefits chart is the council area. Nomis publishes the claimant count monthly for councils back to 2013, so the line is West Suffolk as a whole; the claimant rate elsewhere on this page is Hundon’s built-up area, from small areas.
Questions about work in Hundon
Where do people in Hundon work?
At the 2021 Census, 3% of Hundon’s residents who travelled to work worked in the village itself; the most common other places were Haverhill (48), Bury St Edmunds (24) and Cock and End (11). 51% of working residents worked mainly at home or had no fixed workplace; the Census was taken in lockdown, so home working was unusually high.
How many people commute into Hundon?
15 people who lived elsewhere worked in Hundon at the 2021 Census, 7% of its 201 workers. The most came from Sudbury (6), Bury St Edmunds (3) and Red Lodge (2). 169 residents travelled out the other way.
How many jobs are there in Hundon?
About 130 jobs (employees and working owners) were based in Hundon in 2024, on ONS’s Business Register and Employment Survey: 0.4 for every resident in work, against 0.7 in the typical UK town.
How do people in Hundon get to work?
91% of commuters go by car or van, 3% walk, 2% cycle and 1% take the bus or train; 15% travel under 5 km. Census 2021, taken during lockdown.
What is the average household income in Hundon?
Mean household income before tax was £59,790 in the year to March 2023 (ONS), against £52,385 in the typical UK town.
Sources: ONS Census 2021 origin-destination data, place of work (ODWP01EW), output areas summed to the ONS 2022 built-up area · ONS Census 2021 tables TS058 (distance), TS061 (method of travel), TS063 (occupation) and TS066 (economic activity) · ONS Business Register and Employment Survey via Nomis (open access), by industry division · ONS small-area income estimates (financial year ending 2023); House of Commons Library MSOA names · DWP claimant count via Nomis (towns January to August 2026; councils, regions and England and Wales monthly since January 2015) · MHCLG English Indices of Deprivation 2025 · DfT Transport Connectivity Metric (employment) · TownRatings grades: our own summary of the data, ranked against UK towns only. All under the Open Government Licence v3.0.
Contains public sector information licensed under the Open Government Licence v3.0. Contains HM Land Registry data © Crown copyright and database right 2026. Contains OS data © Crown copyright and database right 2026 (ONS boundaries). Northern Ireland: Source: NISRA; contains Land & Property Services data and Ordnance Survey of Northern Ireland information, © Crown copyright, licensed under the Open Government Licence v3.0. Scotland: contains National Records of Scotland data, Registers of Scotland data and SEPA data, © Crown copyright / © SEPA 2025, licensed under the Open Government Licence v3.0.