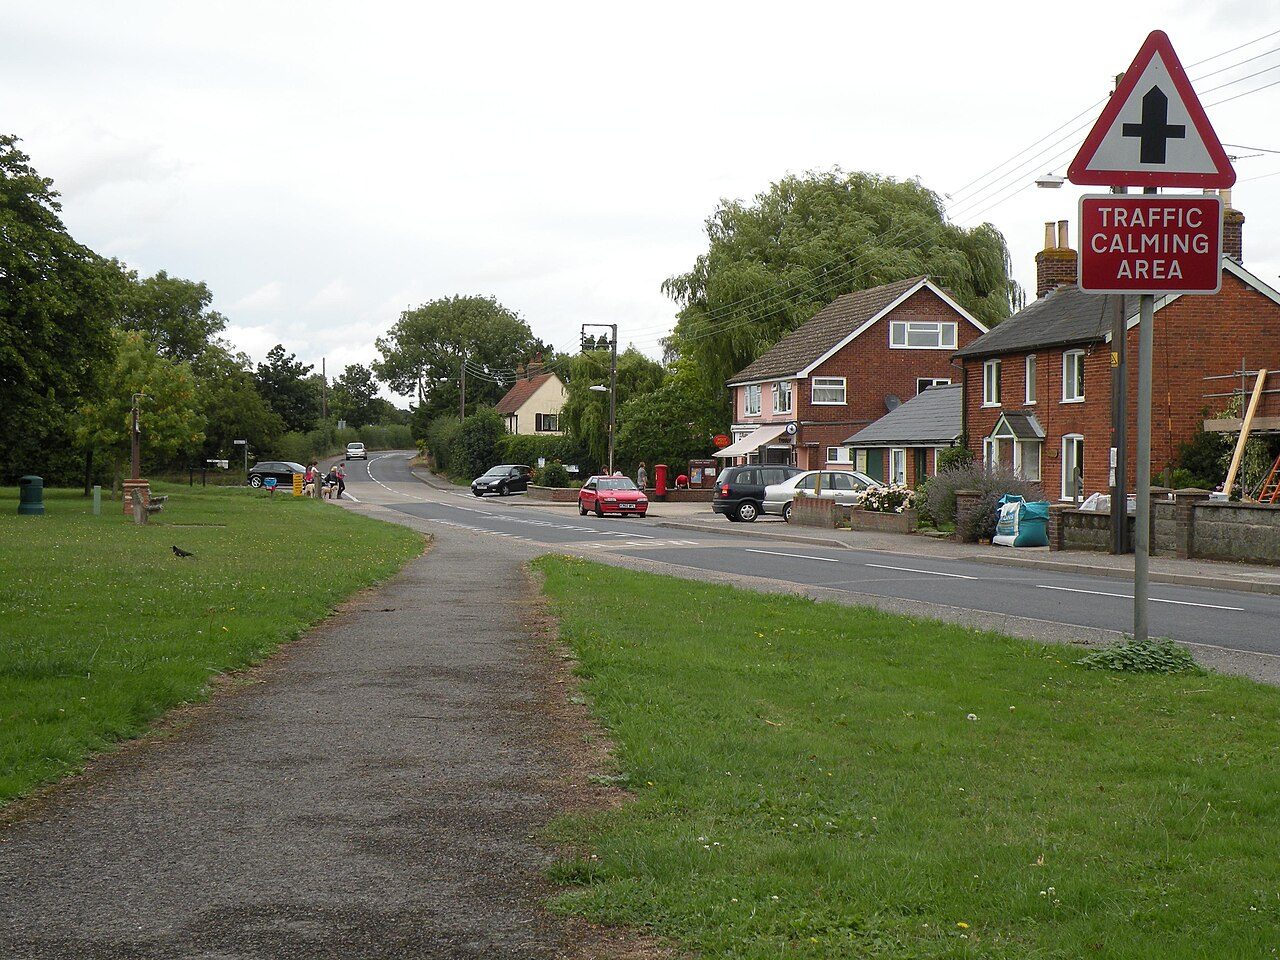
 Photo: Robert Edwards · CC BY-SA 2.0
Almost everyone in Great Waldingfield lives within a 5-minute walk of a park
The Dedham Vale National Landscape begins 4.1 mi from the village’s edge. Footpaths add up to 11 km in the village and the kilometre around it, 1.5 for every square kilometre. Parks and playing fields in Great Waldingfield add up to 2.0 ha for every 1,000 residents; the typical UK town has 2.1. Great Waldingfield grades C for the outdoors. A character grade: it isn’t part of the overall grade.
What kind of outdoors village is Great Waldingfield?
Read from the data: what stands out first, good and bad.
Great Waldingfield’s strongest suit is parks close to every home, followed by the Dedham Vale National Landscape close by. Where it falls short is footpaths.
Great Waldingfield grades C for the outdoors
Each chart is every UK town of 1,000 or more on one measure: the green bar is Great Waldingfield, the dashed line the typical town. The number is the share of towns it beats; the five are averaged and the average ranked again.
100
100
100
100
100
Graded, never part of the overall grade (like History and Civic life). It measures what is mapped: OS Open Greenspace leaves out woodland and open-access land that isn’t a park, and OpenStreetMap’s rural paths are more complete in some places than others.
Great Waldingfield is 34th of 60 UK villages its size for the outdoors
The 60 UK towns and cities of 1,300 to 1,400 people with an Outdoors Grade. Hover a dot for its figures; tap one for its page.
Against villages its size, Great Waldingfield stands out most for homes near a park: none of the other 59 has more. It falls furthest behind on path per km², where 47 of the others do better.
Show as a table
| Town | Outdoors | Green space | Near a park | Path per km² | Protected | |
|---|---|---|---|---|---|---|
| 1 | Tatsfield Surrey | A+ | 7.5 | 100% | 3.1 | 34% |
| 2 | Winsley Wiltshire | A | 12.4 | 79% | 4.2 | 38% |
| 3 | Chilton Oxfordshire | A | 5.4 | 88% | 2.8 | 70% |
| 4 | Cromford Derbyshire | A | 1.8 | 100% | 6.6 | 12% |
| 5 | Cowfold West Sussex | A | 2.6 | 100% | 3.6 | 15% |
| 6 | Gomshall Surrey | A | 1.9 | 89% | 4.8 | 87% |
| 7 | West Horsley Surrey | A | 3 | 74% | 5.2 | 40% |
| 8 | Startforth County Durham | A | 6 | 78% | 4.3 | 4% |
| 9 | Maresfield East Sussex | A | 2.3 | 100% | 2.7 | 44% |
| 10 | Sherston Wiltshire | A | 3.7 | 100% | 1.4 | 75% |
| 11 | Sherfield on Loddon Hampshire | A− | 8.3 | 100% | 3.2 | 0% |
| 12 | Weston Rhyn Shropshire | A− | 3.6 | 100% | 2.2 | 10% |
| 13 | Distington Cumbria | A− | 4.2 | 100% | 1.6 | 0% |
| 14 | Stoke sub Hamdon Somerset | A− | 25.1 | 81% | 4.7 | 0% |
| 15 | Wharncliffe Side South Yorkshire | A− | 3.3 | 47% | 6.4 | 22% |
| 16 | Bradwell Derbyshire | A− | 1.2 | 100% | 2.9 | 100% |
| 17 | Quintrell Downs Cornwall | B+ | 3.3 | 100% | 0.9 | 0% |
| 18 | Appleton Thorn Cheshire | B+ | 5.6 | 100% | 2 | 0% |
| 19 | Barrow Lancashire | B | 0.5 | 100% | 2.8 | 27% |
| 20 | Wymeswold Leicestershire | B | 2.9 | 100% | 2.4 | 0% |
| 21 | Motcombe Dorset | B | 9.5 | 74% | 1.5 | 25% |
| 22 | Trevor Clwyd | B | 2 | 60% | 3.5 | 55% |
| 23 | Cefn Cribwr Mid Glamorgan | B | 6.5 | 100% | 1.2 | 0% |
| 24 | Sampford Peverell Devon | B− | 3 | 100% | 2 | 0% |
| 25 | Holymoorside Derbyshire | B− | 1.1 | 82% | 3.8 | 14% |
| 26 | Narborough Norfolk | B− | 3.8 | 100% | 1.5 | 0% |
| 27 | Kingswood Kent | B− | 3.8 | 23% | 2.7 | 11% |
| 28 | Clwt-y-bont Gwynedd | B− | 0.8 | 100% | 2.1 | 19% |
| 29 | Steeple Bumpstead Essex | B− | 1.9 | 100% | 2.4 | 0% |
| 30 | Trub Greater Manchester | C+ | 1.9 | 100% | 2.3 | 0% |
| 31 | Houghton Cambridgeshire | C+ | 2.2 | 81% | 3.4 | 0% |
| 32 | Launton Oxfordshire | C+ | 0.7 | 100% | 3 | 0% |
| 33 | Thorner West Yorkshire | C+ | 2.1 | 74% | 3.4 | 0% |
| 34 | Great Waldingfield Suffolk | C | 2 | 100% | 1.5 | 0% |
| 35 | East Hendred Oxfordshire | C | 1.4 | 29% | 2.8 | 47% |
| 36 | Great Bardfield Essex | C | 2 | 81% | 2.6 | 0% |
| 37 | Ringstead Northamptonshire | C | 1.8 | 100% | 1.3 | 0% |
| 38 | Tickton East Riding of Yorkshire | C | 2 | 100% | 0.7 | 0% |
| 39 | Winterley Cheshire | C | 0.9 | 100% | 2.3 | 0% |
| 40 | Chelford Cheshire | C | 1.8 | 82% | 2.5 | 0% |
| 41 | Easebourne West Sussex | C | 0.4 | 0% | 2.9 | 100% |
| 42 | Blunham Bedfordshire | C | 2.2 | 77% | 2.3 | 0% |
| 43 | Walkern Hertfordshire | C− | 2.4 | 52% | 2.7 | 0% |
| 44 | Offord D'Arcy and Offord Cluny Cambridgeshire | C− | 2.7 | 78% | 1.5 | 0% |
| 45 | Cottingham and Middleton Northamptonshire | C− | 12.1 | 53% | 1.1 | 0% |
| 46 | Penperlleni Gwent | C− | 0.6 | 80% | 1.7 | 17% |
| 47 | Newton St Loe Somerset | C− | 0 | 0% | 3.5 | 17% |
| 48 | Cowbit Lincolnshire | C− | 0.9 | 100% | 1.1 | 0% |
| 49 | Penrhyn-coch Dyfed | D | 0.7 | 100% | 0.8 | 0% |
| 50 | Hawley Kent | D | 0.7 | 24% | 2.8 | 3% |
| 51 | Perham Down Wiltshire | D | 0.8 | 42% | 2.2 | 17% |
| 52 | Butterwick Lincolnshire | D | 1.8 | 40% | 0.3 | 0% |
| 53 | Malpas Cheshire | D | 1.6 | 61% | 2.2 | 0% |
| 54 | Billingborough Lincolnshire | D | 2.4 | 45% | 1.6 | 0% |
| 55 | North Cave East Riding of Yorkshire | D | 2.5 | 47% | 1.4 | 0% |
| 56 | Skelton (York) North Yorkshire | D | 1.4 | 77% | 1.6 | 0% |
| 57 | Longframlington Northumberland | D | 1.3 | 78% | 1.3 | 0% |
| 58 | Bomere Heath Shropshire | D− | 1.8 | 0% | 1.7 | 0% |
| 59 | Woodmansey East Riding of Yorkshire | D− | 0.7 | 0% | 1.9 | 0% |
| 60 | Griston Norfolk | D− | 0.8 | 15% | 0.5 | 0% |
Parks, footpaths & countryside
Tap a number to zoom to a park. Tap a layer to hide it. The dashed line is Great Waldingfield’s built-up area.
How close Great Waldingfield’s homes are to a park
Each square is 1 in 100 residents: green lives within 400 m of a public park, garden or playing field (Census 2021 output areas against OS Open Greenspace).
Playing fields count, so a park within reach isn’t always one with paths or trees; 14 playgrounds are mapped in and around the village, about one for every 98 residents.
The Dedham Vale National Landscape is 4.1 mi away
Protected landscapes within 30 km, by direction and distance from the edge of the built-up area; circle size shows each one’s area. National Landscapes were called Areas of Outstanding Natural Beauty until 2023.
Protected landscape begins just outside the 5 km ring the Outdoors Grade measures, so Great Waldingfield scores 0% on it even though the Dedham Vale National Landscape is 4.1 mi away.
Footpaths in and around Great Waldingfield
11 km of footpaths, bridleways and rights of way are mapped in Great Waldingfield and the kilometre around it, 1.5 km for every square kilometre (the typical UK town has 3.0).
No named walking route is mapped within 2 km of Great Waldingfield; its footpaths are on the map above.
Waymarked walks are OpenStreetMap walking routes. Public rights of way are only as complete as the map in each area.
The best walking months in Great Waldingfield: May to September
The village’s 1991–2020 averages (Met Office HadUK-Grid) and the daylight at its latitude. Outlined months have 12½+ hours of daylight, highs of 15 °C or more and little rain for the town.
| Jan | Feb | Mar | Apr | May | Jun | Jul | Aug | Sep | Oct | Nov | Dec | |
|---|---|---|---|---|---|---|---|---|---|---|---|---|
| Daylight (h) | 8.2 | 9.8 | 11.7 | 13.8 | 15.7 | 16.7 | 16.3 | 14.6 | 12.6 | 10.5 | 8.7 | 7.8 |
| High (°C) | 7 | 8 | 11 | 14 | 17 | 20 | 23 | 23 | 19 | 15 | 11 | 8 |
| Rain (mm) | 52 | 45 | 39 | 40 | 47 | 52 | 51 | 65 | 49 | 65 | 65 | 60 |
March is the driest month (39 mm) and July the warmest (highs of 23 °C). Winter days are short, about 8 hours of daylight in December, and 65 mm of rain falls in October, the wettest month. Frost comes on about 44 nights a year. The climate in Great Waldingfield →
14 playgrounds and the nearest beaches
Mapped within 2 km of the village in OpenStreetMap, against the typical UK village its size per resident. Named places are listed with directions; unnamed ones are only counted.
The nearest beaches
Great Waldingfield is inland. These are the nearest named beaches, measured from the edge of the village.
Check the water before you swim. The Environment Agency tests designated bathing waters from May to September and publishes a rating for each beach.
Every named place, with directions
Playgrounds 14
Plus 13 playgrounds without a name on the map.
The outdoors in nearby towns
The nearest towns of 1,000+ within 12 miles. Tap a town for its outdoors page.
Bures, 5.7 miles away, grades A, the best next door: every resident lives within 400 m of a park. Long Melford, Lavenham and Bures have at least twice Great Waldingfield’s green space per resident.
Questions about the outdoors in Great Waldingfield
Is Great Waldingfield near a National Park?
The nearest protected landscape is the Dedham Vale National Landscape, 4.1 mi south-east of the village’s edge. It covers 91 km² and was designated in 1970.
What is the nearest beach to Great Waldingfield?
Trimley Shores, 22 mi from the edge of the village, then Weymarks Beach (22 mi). Great Waldingfield itself is inland.
How many people in Great Waldingfield live near a park?
100% of residents live within 400 m, about a 5-minute walk, of a public park, garden or playing field (Census 2021 output areas against OS Open Greenspace). The typical UK town is 83%.
When is the best time of year for walking in Great Waldingfield?
May to September: the longest days, the warmest afternoons and the least rain of the year, from the Met Office 1991–2020 averages.
Is Great Waldingfield good for walking?
Paths are thinner than most towns: 1.5 km of footpath and right of way per square kilometre, more than 16% of UK towns. For park space per person it beats 44% (2.0 ha per 1,000 residents).
How is the Outdoors Grade worked out?
From five measures, each placed among UK towns of 1,000 or more: public green space per resident, the share living near a park, National Park or National Landscape within 5 km, footpaths per square kilometre, and the sea within 5 km. It is a character grade and isn’t part of Great Waldingfield’s overall grade.
Where Great Waldingfield’s outdoors figures come from
- Parks and green space: Ordnance Survey OS Open Greenspace (parks and gardens, playing fields, play spaces, and their access points). Contains OS data © Crown copyright and database right 2026, Open Government Licence v3.0.
- National Parks and National Landscapes: Natural England and Natural Resources Wales boundaries, areas and designation dates, Open Government Licence v3.0.
- Footpaths, walking routes, beaches and things to do: © OpenStreetMap contributors, Open Database License (ODbL), via Geofabrik, 16 October 2026.
- Historic parks, listed buildings and monuments: Historic England, National Heritage List for England, Open Government Licence v3.0.
- Rain and temperature: Met Office HadUK-Grid 1991–2020 averages for the town; daylight calculated from its latitude.
- The sea: ONS Countries (December 2024) boundaries clipped to mean high water. Residents near a park: ONS Census 2021 output areas.
- Grade: TownRatings’ Outdoors Grade, ranked against UK towns only.
Contains public sector information licensed under the Open Government Licence v3.0. Contains HM Land Registry data © Crown copyright and database right 2026. Contains OS data © Crown copyright and database right 2026 (ONS boundaries). Northern Ireland: Source: NISRA; contains Land & Property Services data and Ordnance Survey of Northern Ireland information, © Crown copyright, licensed under the Open Government Licence v3.0. Scotland: contains National Records of Scotland data, Registers of Scotland data and SEPA data, © Crown copyright / © SEPA 2025, licensed under the Open Government Licence v3.0.