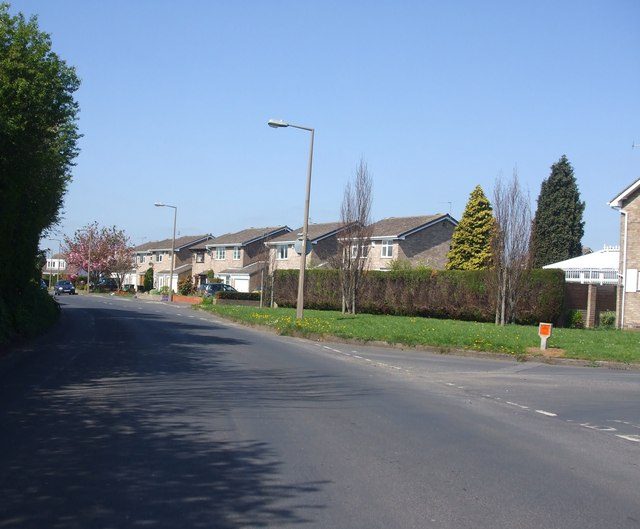
 Photo: Glyn Drury · CC BY-SA 2.0
Parks and walks in Branton
Parks and playing fields in Branton add up to 1.1 ha for every 1,000 residents; the typical UK town has 2.1. 71% of residents live within a 5-minute walk of a park or playing field. 27 km of footpaths run through the village and the kilometre around it, 3.0 for every square kilometre. Branton grades C− for the outdoors. A character grade: it isn’t part of the overall grade.
Branton grades C− for the outdoors
Each chart is every UK town of 1,000 or more on one measure: the green bar is Branton, the dashed line the typical town. The number is the share of towns it beats; the five are averaged and the average ranked again.
100
100
100
100
100
Graded, never part of the overall grade (like History and Civic life). It measures what is mapped: OS Open Greenspace leaves out woodland and open-access land that isn’t a park, and OpenStreetMap’s rural paths are more complete in some places than others.
Branton is 49th of 60 UK villages its size for the outdoors
The 60 UK towns and cities of 1,700 to 1,900 people with an Outdoors Grade. Hover a dot for its figures; tap one for its page.
Against villages its size, Branton stands out most for path per km²: only 20 of the other 59 have more. It falls furthest behind on park space per resident, where 50 of the others do better.
Show as a table
| Town | Outdoors | Green space | Near a park | Path per km² | Protected | |
|---|---|---|---|---|---|---|
| 1 | Llanberis Gwynedd | A+ | 33.7 | 100% | 3.9 | 49% |
| 2 | St Just Cornwall | A+ | 1.8 | 100% | 4.2 | 50% |
| 3 | Southwick Wiltshire | A+ | 22.2 | 100% | 5.2 | 1% |
| 4 | Market Lavington Wiltshire | A+ | 9.9 | 100% | 4.1 | 1% |
| 5 | Rogiet Gwent | A+ | 3.9 | 100% | 2.2 | 0% |
| 6 | Mistley Essex | A | 4.3 | 86% | 1.9 | 41% |
| 7 | Colwall Stone Herefordshire | A | 4.5 | 67% | 5.5 | 64% |
| 8 | New Denham Buckinghamshire | A | 8.9 | 100% | 3.8 | 0% |
| 9 | Scalby North Yorkshire | A | 5.9 | 70% | 2 | 43% |
| 10 | Wembury Devon | A− | 2.4 | 53% | 2.7 | 41% |
| 11 | Tow Law County Durham | A− | 4.1 | 100% | 1.3 | 21% |
| 12 | Horam East Sussex | B+ | 3.9 | 91% | 1.4 | 46% |
| 13 | Painswick Gloucestershire | B+ | 1.3 | 81% | 4.3 | 83% |
| 14 | Tongwynlais South Glamorgan | B+ | 8.6 | 65% | 5.8 | 0% |
| 15 | Marks Tey Essex | B+ | 5.5 | 92% | 2.7 | 0% |
| 16 | Findon West Sussex | B+ | 1.7 | 74% | 3.7 | 70% |
| 17 | Bishop's Castle Shropshire | B+ | 2 | 100% | 1.3 | 53% |
| 18 | Weston Turville Buckinghamshire | B | 2.9 | 64% | 3.1 | 30% |
| 19 | Fernhurst West Sussex | B | 3.1 | 37% | 3 | 92% |
| 20 | Ironville Derbyshire | B | 1.6 | 100% | 4.1 | 0% |
| 21 | Northop Hall Clwyd | B | 2.6 | 100% | 2.7 | 0% |
| 22 | Rhayader Powys | B | 5.5 | 100% | 1.6 | 0% |
| 23 | Hemingfield South Yorkshire | B | 3.3 | 80% | 3.7 | 0% |
| 24 | Hughenden Valley Buckinghamshire | B− | 2.1 | 32% | 3.4 | 76% |
| 25 | Chilcompton Somerset | B− | 6.5 | 40% | 2.9 | 1% |
| 26 | Yelverton Devon | B− | 3.6 | 72% | 1.1 | 85% |
| 27 | Holbrook Derbyshire | B− | 4.2 | 55% | 4.5 | 0% |
| 28 | Warton (Lancaster) Lancashire | B− | 0.3 | 32% | 3.5 | 43% |
| 29 | Meldreth Cambridgeshire | B− | 4.7 | 82% | 2.6 | 0% |
| 30 | Inkberrow Worcestershire | B− | 5.3 | 83% | 2.4 | 0% |
| 31 | Ingrave and Herongate Essex | B− | 5 | 51% | 4 | 0% |
| 32 | Newcastle Emlyn Dyfed | B− | 5.9 | 100% | 0.4 | 0% |
| 33 | Warden Kent | B− | 1.4 | 100% | 0.9 | 0% |
| 34 | High Halstow Kent | B− | 1.7 | 76% | 2.8 | 0% |
| 35 | Copford Essex | B− | 4 | 70% | 3.1 | 0% |
| 36 | Barnburgh and Harlington South Yorkshire | B− | 1.8 | 100% | 2.5 | 0% |
| 37 | Great Yeldham Essex | C+ | 3.1 | 86% | 2.3 | 0% |
| 38 | Lowdham Nottinghamshire | C+ | 3.7 | 85% | 1.8 | 0% |
| 39 | Pontlottyn Gwent | C+ | 1.8 | 70% | 4.2 | 0% |
| 40 | Withnoe Cornwall | C+ | 1.4 | 100% | 0.9 | 3% |
| 41 | Ryton-on-Dunsmore Warwickshire | C | 1.2 | 100% | 2.5 | 0% |
| 42 | Walkington East Riding of Yorkshire | C | 2.3 | 100% | 1 | 0% |
| 43 | Dunkeswell Devon | C | 1.4 | 83% | 0.7 | 87% |
| 44 | Lympstone Devon | C | 1 | 66% | 1.3 | 16% |
| 45 | Penygroes Gwynedd | C− | 0.7 | 66% | 0.6 | 26% |
| 46 | Scotby Cumbria | C− | 3 | 75% | 1.6 | 0% |
| 47 | Drakes Broughton Worcestershire | C− | 1 | 86% | 2.8 | 0% |
| 48 | Woolpit Suffolk | C− | 4.3 | 54% | 1.7 | 0% |
| 49 | Branton South Yorkshire | C− | 1.1 | 71% | 3 | 0% |
| 50 | Bradninch Devon | D | 2.3 | 73% | 1.1 | 0% |
| 51 | Rickinghall and Botesdale Suffolk | D | 1.7 | 61% | 1.9 | 0% |
| 52 | Harston Cambridgeshire | D | 1.6 | 45% | 2.1 | 0% |
| 53 | Stainton North Yorkshire | D | 0.5 | 0% | 3.2 | 0% |
| 54 | Barnetby le Wold Lincolnshire | D | 1.8 | 59% | 1.2 | 0% |
| 55 | Mickle Trafford Cheshire | D− | 0.5 | 70% | 1.8 | 0% |
| 56 | Audlem Cheshire | D− | 0.6 | 50% | 2.2 | 0% |
| 57 | Great Barton Suffolk | D− | 1.6 | 19% | 0.5 | 0% |
| 58 | Pentre Maelor Clwyd | D− | 1.4 | 8% | 0.8 | 0% |
| 59 | Bardsey West Yorkshire | D− | 0.1 | 0% | 1.5 | 0% |
| 60 | Wainfleet All Saints Lincolnshire | D− | 0 | 0% | 0.7 | 0% |
Parks, footpaths & countryside
Tap a number to zoom to a park. Tap a layer to hide it. The dashed line is Branton’s built-up area.
7 in 10 Branton residents live within a 5-minute walk of a park
Each square is 1 in 100 residents: green lives within 400 m of a public park, garden or playing field (Census 2021 output areas against OS Open Greenspace).
About 500 people live further than that. Playing fields count, so a park within reach isn’t always one with paths or trees; 18 playgrounds are mapped in and around the village, about one for every 101 residents.
Footpaths in and around Branton
27 km of footpaths, bridleways and rights of way are mapped in Branton and the kilometre around it, 3.0 km for every square kilometre (the typical UK town has 3.0).
No named walking route is mapped within 2 km of Branton; its footpaths are on the map above.
Waymarked walks are OpenStreetMap walking routes. Public rights of way are only as complete as the map in each area.
The best walking months in Branton: May to September
The village’s 1991–2020 averages (Met Office HadUK-Grid) and the daylight at its latitude. Outlined months have 12½+ hours of daylight, highs of 15 °C or more and little rain for the town.
| Jan | Feb | Mar | Apr | May | Jun | Jul | Aug | Sep | Oct | Nov | Dec | |
|---|---|---|---|---|---|---|---|---|---|---|---|---|
| Daylight (h) | 8.0 | 9.7 | 11.7 | 13.9 | 15.9 | 17.0 | 16.5 | 14.8 | 12.6 | 10.4 | 8.5 | 7.5 |
| High (°C) | 8 | 8 | 11 | 14 | 17 | 20 | 22 | 22 | 19 | 15 | 10 | 8 |
| Rain (mm) | 42 | 39 | 37 | 43 | 45 | 64 | 62 | 55 | 51 | 55 | 58 | 55 |
March is the driest month (37 mm) and July the warmest (highs of 22 °C). Winter days are short, about 7 hours of daylight in December, and 64 mm of rain falls in June, the wettest month. Frost comes on about 36 nights a year. The climate in Branton →
Beaches near Branton
0% of the area within 5 km of Branton is sea, so the Outdoors Grade counts it as inland. 3 beaches are mapped within 5 km.
Sea: the area outside the ONS coastline (mean high water). Bathing water quality is published by the Environment Agency (England) and Natural Resources Wales; check it before swimming.
2 viewpoints and 18 playgrounds
Mapped within 2 km of the village in OpenStreetMap, against the typical UK village its size per resident. Named places are listed with directions; unnamed ones are only counted.
Every named place, with directions
Viewpoints 2
Plus 2 viewpoints without a name on the map.
Waterfalls 1
Plus 1 waterfall without a name on the map.
Picnic sites 4
Plus 4 picnic sites without a name on the map.
Playgrounds 18
Plus 11 playgrounds without a name on the map.
Campsites 1
The outdoors in nearby towns
The nearest towns of 1,000+ within 12 miles. Tap a town for its outdoors page.
| Town | Outdoors | Green space, ha per 1,000 | Near a park | Protected within 5 km |
|---|---|---|---|---|
| Branton | C− | 1.1 | 71% | 0% |
| Auckley 0.7 mi | B+ | 4.9 | 100% | 0% |
| Finningley 1.6 mi | D | 2.0 | 65% | 0% |
| Armthorpe 2.1 mi | B+ | 6.4 | 92% | 0% |
| New Rossington and Rossington 2.8 mi | D | 0.8 | 50% | 0% |
| Doncaster 3.2 mi | C | 1.8 | 72% | 0% |
| Hatfield Woodhouse 3.7 mi | C− | 0.6 | 100% | 0% |
Auckley, 0.7 miles away, grades B+, the best next door: every resident lives within 400 m of a park. Auckley and Armthorpe have at least twice Branton’s green space per resident. None of the neighbours has a protected landscape within 5 km either.
Questions about the outdoors in Branton
Is Branton near a National Park?
No National Park or National Landscape is within 30 km (about 19 miles) of Branton.
How many people in Branton live near a park?
71% of residents live within 400 m, about a 5-minute walk, of a public park, garden or playing field (Census 2021 output areas against OS Open Greenspace). The typical UK town is 83%.
When is the best time of year for walking in Branton?
May to September: the longest days, the warmest afternoons and the least rain of the year, from the Met Office 1991–2020 averages.
Is Branton good for walking?
About average for paths: 3.0 km of footpath and right of way per square kilometre, more than 59% of UK towns. For park space per person it beats 16% (1.1 ha per 1,000 residents).
How is the Outdoors Grade worked out?
From five measures, each placed among UK towns of 1,000 or more: public green space per resident, the share living near a park, National Park or National Landscape within 5 km, footpaths per square kilometre, and the sea within 5 km. It is a character grade and isn’t part of Branton’s overall grade.
Where Branton’s outdoors figures come from
- Parks and green space: Ordnance Survey OS Open Greenspace (parks and gardens, playing fields, play spaces, and their access points). Contains OS data © Crown copyright and database right 2026, Open Government Licence v3.0.
- National Parks and National Landscapes: Natural England and Natural Resources Wales boundaries, areas and designation dates, Open Government Licence v3.0.
- Footpaths, walking routes, beaches and things to do: © OpenStreetMap contributors, Open Database License (ODbL), via Geofabrik, 16 October 2026.
- Historic parks, listed buildings and monuments: Historic England, National Heritage List for England, Open Government Licence v3.0.
- Rain and temperature: Met Office HadUK-Grid 1991–2020 averages for the town; daylight calculated from its latitude.
- The sea: ONS Countries (December 2024) boundaries clipped to mean high water. Residents near a park: ONS Census 2021 output areas.
- Grade: TownRatings’ Outdoors Grade, ranked against UK towns only.
Contains public sector information licensed under the Open Government Licence v3.0. Contains HM Land Registry data © Crown copyright and database right 2026. Contains OS data © Crown copyright and database right 2026 (ONS boundaries). Northern Ireland: Source: NISRA; contains Land & Property Services data and Ordnance Survey of Northern Ireland information, © Crown copyright, licensed under the Open Government Licence v3.0. Scotland: contains National Records of Scotland data, Registers of Scotland data and SEPA data, © Crown copyright / © SEPA 2025, licensed under the Open Government Licence v3.0.