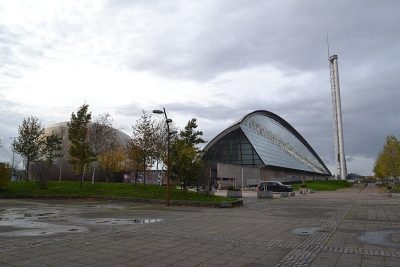
Buying a home costs less than in most towns: homes sell for a median £125,500, about 3 times local household income. It is strong on walkability as well — a quarter of commuters get to work on foot, by bike or by public transport. Health lags: men here can expect to live to 74.5, women to 79.8. Hazard risk is weaker too (C−): 3.7% of homes face a high or medium risk of river or sea flooding.
Figures: prices, HM Land Registry, the last three years · commuting, Census 2022 · life expectancy, ONS · flood risk, SEPA. Without street-level crime figures from Police Scotland, Paisley has no Safety Grade, and so no overall grade. Every other subject still has a grade below.
Each subject compared with the 2,160 UK towns with an overall grade (schools within Scotland), ordered by how far Paisley is from typical. American towns are graded separately.
Without street-level crime figures from Police Scotland, Paisley has no Safety Grade, and so no overall grade. Every other subject still has a grade below.
Data highlights are ordered by what stands out in Paisley.
Health
Paisley’s life expectancy trails 96% of UK towns
At the census, nearly one in ten residents said their health was bad or very bad, above both Renfrewshire’s towns (7.7%) and Scotland’s towns (7.2%). A disability affects just over a quarter of people in Paisley. Self-reported good health: 76% of the town’s residents.
Scotland’s Census 2022, general health and disability · Public Health Scotland life expectancy by intermediate zone, 2020–24 · OGL · Because the census answers ignore age, a younger population lifts them; that is why the Health Grade is built on age-adjusted measures like life expectancy and early deaths.
SchoolsC+
Paisley’s schools fall behind 60% of Scottish towns on results
Of its 24 schools, two are shown below, each with the reason. Between them, 19 primaries and four secondaries teach 9,390 pupils in Paisley.
Scottish Government · school statistics and leavers’ results · The grade uses the secondaries its children go to; Scotland publishes no primary results by school.See all 24 schools →
HousingCost of living grade A
Buying in Paisley costs less than in both Renfrewshire’s towns and Scotland’s towns, at an estimated median of £126K
Private renters make up 14% of households. Owners make up 58% of households, below Renfrewshire’s towns (65%) and close to Scotland’s towns (60%). Council and housing-body homes hold just over a quarter of households.
£126Kmedian sale
Median sale price · 2023 to 2025, at early-2025 prices
Paisley£126K
Typical UK town£277K
58%
of households own their home · Scotland 60%
14%
rent privately · Scotland 13%
£768
average private rent a month, Renfrewshire / Inverclyde council area
Registers of Scotland data-zone sale prices · Scottish Government council tax · Scotland’s Census 2022 tenure · OGL · The Scottish median is our estimate from data-zone sales, brought to early-2025 prices.
Work & commute
3.7% of 16 to 64s in Paisley claim unemployment benefits, more than in both Renfrewshire’s towns and Scotland’s towns
Scotland’s Census was taken on 20 March 2022, a year after England and Wales’s lockdown census; 30% of workers were mainly at home, and shares here are of those who travelled.
The car took 72% of commuters, lower than Renfrewshire’s towns (76%) yet higher than Scotland’s towns (70%). About 34% of its commuters stay in Paisley for work. This Renfrewshire town counts 1.2 jobs per working resident.
Scotland’s Census 2022 (NRS), method of travel and distance to work · DWP claimant count · OGL
History
Paisley has 273 listed buildings, 24 of them in the top category
The heritage lists give each building’s grade but not its age, so we don’t say which is oldest.
Paisley’s listed buildings include the Abbey Close Place of Paisley, Category A. Of the town’s land, 3% lies in conservation areas, above both Renfrewshire’s towns (0%) and Scotland’s towns (1%). Category B covers 174 of them, Category A 24.
273listed buildings
Listed buildings by grade · Historic Environment Scotland
Gerard Butler: Gordon Correll, CC BY-SA 2.0 · Gerry Rafferty: Eddie Mallin, CC BY-SA 2.0 · Steven Moffat: Gage Skidmore, CC BY-SA 3.0 · Paolo Nutini: Ueli Frey, CC BY-SA 4.0
Paisley’s neighbours
The nearest towns and villages, from National Records of Scotland’s 2022 localities. See them on the map →
No Scottish town has a Safety Grade or an overall grade yet: Police Scotland doesn’t publish street-level crime. People: Census 2022. Miles: centre to centre.
Questions about Paisley
Is Paisley expensive to live in?
On cost of living it is the 152nd most affordable of 296 Scottish towns.
Does Paisley flood?
Surface water isn’t included. Check a specific address on GOV.UK’s flood risk service.
How much is council tax in Paisley?
Band D council tax in Paisley is £1,691 for 2026–27, less than in 90% of UK towns (council, county, police and fire). Your own bill depends on your home’s band; check it on GOV.UK.
About Paisley
Large town in Renfrewshire, Scotland
Paisley is a locality of 79,351 people, in the Renfrewshire council area. TownRatings uses National Records of Scotland’s 2022 localities as Scotland’s towns: the physical town, as people mean the word, rather than a council area, so its figures cover the town itself. Localities split the big settlements into their towns, as ONS’s 2022 boundaries split conurbations in England and Wales.
Built from NRS geography and Census 2022
Population
79,351 (Census 2022)
Council
Renfrewshire
Nation
Scotland
Area
10.1 sq mi (26.3 km²)
NRS code
S52000504
Sources: Scotland’s Census 2022 (National Records of Scotland), output areas summed to the NRS 2022 locality · Registers of Scotland house price statistics, medians and quartiles of residential sales by 2022 data zone, 2004 to 2025 (the 2023 to 2025 headline brought to early-2025 prices with each council’s medians) · Scottish Government, Council Tax by band 2026-27; Scottish Water charges 2026-27 · Scottish Government, Recorded Crime in Scotland (crimes, offences and clear-up rates by council area, 2016-17 to 2025-26); Scottish Index of Multiple Deprivation 2020v2 crime domain and SIMD crime indicators (2014/15, 2017/18), 2011 data zones with Census 2022 residents · ONS gross disposable household income by council (2022), scaled to household income on England and Wales’s councils, with Scotland’s Census 2022 households · DWP / ONS Claimant Count via Nomis (2022 data zones, January to August 2026), over residents aged 16 to 64 at Scotland’s Census 2022; council series since 2015 · Scottish Government school contact list (31 July 2026) and school summary statistics (pupil census, September 2025); School Information Dashboard leavers’ attainment by school, 2022-23 to 2024-25 (data.gov.scot) · TownRatings grades: our own summary of the data, ranked against UK towns only. All under the Open Government Licence v3.0.