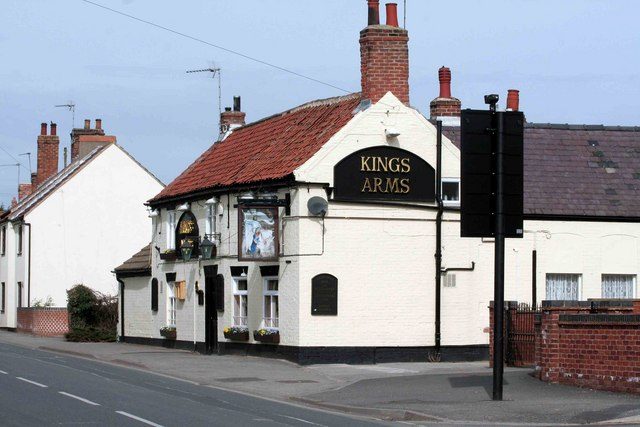
 Photo: roger geach · CC BY-SA 2.0
The median home in Clarborough sells for £220,000
That is the middle of 48 standard sales recorded by HM Land Registry from September 2023 to August 2026, against £277,000 in the typical UK town. The typical home sells for 4.7 times as much as in 1995. Below: what each type of home sells for, the spread of prices, every year since 1995, new builds, the busiest streets and the neighbours. Rents and council tax are on Cost of living.
60% of Clarborough’s sales are detached houses
48 homes sold in three years: 29 detached houses, 14 semi-detached houses and 5 terraced houses.
median sale · 29 sold in 3 years
- Middle half
- £215K–£430K
- Last 12 months
- £323K12 sold
median sale · 14 sold in 3 years
- Middle half
- £150K–£220K
- Last 12 months
- £220K5 sold
Terraced houses: 5 sold, median £155K
Too few sales for a card of their own.
Mostly detached: 60% of homes sold stand on their own plot
Standard sales, Sep 2023 to Aug 2026. A median needs 5 sales of a type; “middle half” is the 25th to 75th percentile of 10 or more.
Half of Clarborough’s homes sold for between £170K and £350K
One sale in ten was under £136K and one in ten over £528K. 56% sold for under £250K.
The median, £220,000, sits in the £200–250K band
48 standard sales. Each bar is the number sold in that price band; the darker bar holds the median.
The typical home costs 4.7 times as much as in 1995, a slower rise than England’s
Land Registry has recorded every sale since 1995. The median went from £53,500 in 1995 to £252,500 in the last 12 months (£216,000 in 2019).
About as many homes sell as usual
18 sales in the last 12 months, against 31 in 2021, the busiest year, and 10 in 2011. Sales fell by 25% from 2007 to 2009 in the financial crisis, though the median held. 2021, the stamp duty holiday, saw 82% more sales than 2020.
Clarborough costs about what England does
Median sale price each calendar year: Clarborough, every standard sale in England, and the typical UK town (the middle of the town medians, towns of 2,500 or more).
Semi-detached houses rose the most since 1995
| 1995 | 2000 | 2005 | 2010 | 2015 | 2020 | Last 12 months | |
|---|---|---|---|---|---|---|---|
| Detached houses | £87K | £65K | £142K | £184K | £215K | £273K | £323K |
| Semi-detached houses | £44K | £41K | £127K | — | — | £168K | £220K |
Calendar years; a year’s median needs 5 sales of the type, so gaps are years with fewer.
Prices are as paid, not adjusted for inflation. Standard (category A) sales only; Land Registry adds a sale when it is registered, so the newest months fill in later.
Hardly any new homes: 0% of sales in the last 12 months
5 new homes have been sold in Clarborough since 1995; the share peaked at 6% in 2010.
Calendar years with 10 or more sales, then the last 12 months.
0% of sales were leasehold
Nearly every flat in England and Wales is leasehold; among houses, 0% sold leasehold in Clarborough. A leasehold buyer owns the home for a fixed term and may pay ground rent and service charges; check the lease before you buy.
Church Lane is Clarborough’s busiest street, with 11 sales in three years
5 streets had five or more sales from Sep 2023 to Aug 2026, 1 of them ten or more. A busy street is often a new estate selling its first homes, or a long road of terraces and flats.
| # | Street | Postcode area | Sales | Median | Homes |
|---|---|---|---|---|---|
| 1 | Church Lane | DN22 | 11 | £337,000 | Mostly detached houses |
| 2 | St Johns Drive | DN22 | 8 | £207,500 | Mostly detached houses |
| 3 | Main Street | DN22 | 6 | £447,500 | Mostly detached houses |
| 4 | Smeath Lane | DN22 | 6 | £190,000 | Mostly semi-detached houses |
| 5 | Gill Green Walk | DN22 | 5 | £145,000 | Mostly terraced houses |
Standard sales with a street name, grouped by street and postcode district (Sep 2023 to Aug 2026); a name used in two districts shows the district. Medians only: we don’t list individual sales.
Clarborough’s neighbours
Cheaper nearby: Retford.
| Town | Miles | Median | Sold, 12 mo | Since 2016 |
|---|---|---|---|---|
| Clarborough | — | £220K | 18 | +31% |
| Retford | 2.4 | £195K | 298 | +39% |
| North Leverton with Habblesthorpe | 3.7 | £230K | 18 | +46% |
| Ranby | 4.1 | — | 4 | — |
| Ranskill | 5 | £285K | 17 | +47% |
| Beckingham | 5.1 | £270K | 18 | +69% |
| Lea | 6.6 | £240K | 19 | +63% |
| Blyth | 6.6 | £340K | 12 | +73% |
Median: standard sales over three years (10+ needed). Since 2016: the median over three years against 2016’s. Miles: centre to centre.
Questions about property prices in Clarborough
What is the average house price in Clarborough?
The median home in Clarborough sold for £220,000 from September 2023 to August 2026, across 48 standard sales (£252,500 in the last 12 months). By type: detached houses £330,000, semi-detached houses £195,000 and terraced houses £155,000.
Are house prices going up in Clarborough?
The median was £315,000 in 2025, up 45% on 2024 (£217,500), and £252,500 in the last 12 months. A town’s median moves with the mix of homes sold each year as well as with prices.
How many homes sell in Clarborough each year?
18 standard sales were recorded in the last 12 months, against an average of 20 a year since 2015. Repossessions, company purchases and other non-standard sales aren’t counted.
Sources: HM Land Registry Price Paid, every standard sale since January 1995 (yearly files of 28 September 2026), inside the ONS 2022 built-up-area boundary by postcode (ONS Postcode Directory) · TownRatings grades: our own summary of the data, ranked against UK towns only. All under the Open Government Licence v3.0.
Contains HM Land Registry data © Crown copyright and database right 2026. This data is licensed under the Open Government Licence v3.0. Postcodes placed with the ONS Postcode Directory (contains OS data © Crown copyright and database right 2026; contains Royal Mail data © Royal Mail copyright and database right 2026).
Contains public sector information licensed under the Open Government Licence v3.0. Contains HM Land Registry data © Crown copyright and database right 2026. Contains OS data © Crown copyright and database right 2026 (ONS boundaries). Northern Ireland: Source: NISRA; contains Land & Property Services data and Ordnance Survey of Northern Ireland information, © Crown copyright, licensed under the Open Government Licence v3.0. Scotland: contains National Records of Scotland data, Registers of Scotland data and SEPA data, © Crown copyright / © SEPA 2025, licensed under the Open Government Licence v3.0.