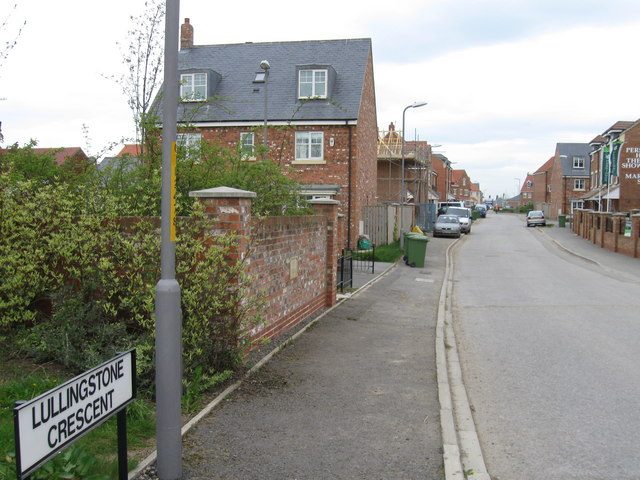
Outdoors in Ingleby Barwick · parks, paths & countryside
Ingleby Barwick has more footpath per square kilometre than 9 in 10 UK towns
111 km of footpaths run through the town and the kilometre around it, 6.1 for every square kilometre. The North York Moors National Park begins 5.5 mi from the town’s edge. Parks and playing fields in Ingleby Barwick add up to 2.9 ha for every 1,000 residents; the typical UK town has 2.1. Ingleby Barwick grades B+ for the outdoors: #16 of 54 in North Yorkshire. A character grade: it isn’t part of the overall grade.
Ingleby Barwick’s strongest suit is dense footpaths, followed by the North York Moors National Park close by.
Outdoors grade
Ingleby Barwick grades B+ for the outdoors
Each chart is every UK town of 1,000 or more on one measure: the green bar is Ingleby Barwick, the dashed line the typical town. The number is the share of towns it beats; the five are averaged and the average ranked again.
B+
Better than 74% of UK towns#16 of 54 in North Yorkshire · 22nd of 60 UK towns its size
Public green space2.9 haper 1,000 residents: parks, gardens, playing fields, play spaces
67out of 100
A park within a walk87%of residents within 400 m (a 5-minute walk)
60out of 100
National Park or National Landscape0%of the land within 5 km · North York Moors begins just past 5 km
31out of 100
Footpaths6.1 kmper km², the town and 1 km around it
98out of 100
The sea0%of the area within 5 km · Inland
42out of 100
Graded, never part of the overall grade (like History and Civic life). It measures what is mapped: OS Open Greenspace leaves out woodland and open-access land that isn’t a park, and OpenStreetMap’s rural paths are more complete in some places than others.
Towns its size
Ingleby Barwick is 22nd of 60 UK towns its size for the outdoors
The 60 UK towns and cities of 21,600 to 25,300 people with an Outdoors Grade. Hover a dot for its figures; tap one for its page.
Outdoors score: the share of UK towns each one beats
Footpath, km per km²
Ingleby Barwick6.1
Towns its size3.5
North Yorkshire towns2.0
All UK towns3.0
Green space, ha per 1,000 residents
Ingleby Barwick2.9
Towns its size2.5
North Yorkshire towns1.7
All UK towns2.1
Residents within 400 m of a park
Ingleby Barwick87%
Towns its size84%
North Yorkshire towns80%
All UK towns83%
Against towns its size, Ingleby Barwick stands out most for path per km²: only 3 of the other 59 have more.
9 in 10 Ingleby Barwick residents live within a 5-minute walk of a park
Each square is 1 in 100 residents: green lives within 400 m of a public park, garden or playing field (Census 2021 output areas against OS Open Greenspace).
Within 400 m (87%)Further (14%)
Ingleby Barwick87%
Towns its size84%
North Yorkshire towns80%
All UK towns83%
About 3,000 people live further than that. Playing fields count, so a park within reach isn’t always one with paths or trees; 38 playgrounds are mapped in and around the town, about one for every 615 residents.
National Parks & National Landscapes
The North York Moors National Park is 5.5 mi away
Protected landscapes within 30 km, by direction and distance from the edge of the built-up area; circle size shows each one’s area. National Landscapes were called Areas of Outstanding Natural Beauty until 2023.
National ParkNational LandscapeThe 5 km the grade counts
Protected landscape begins just outside the 5 km ring the Outdoors Grade measures, so Ingleby Barwick scores 0% on it even though the North York Moors National Park is 5.5 mi away. North York Moors National Park covers 1,441 km² and has been a National Park since 1952.
Footpaths & waymarked walks
3 waymarked walks pass through or near Ingleby Barwick
111 km of footpaths, bridleways and rights of way are mapped in Ingleby Barwick and the kilometre around it, 6.1 km for every square kilometre (the typical UK town has 3.0). Bars show each route’s kilometres within 2 km of the town.
RegionalLocal
Teesdale Way (Middleton in Teesdale to Middlesbrough)12.7 km
Thornaby Trail Loop7.2 km
Thornaby Trail Connections1.8 km
Close to home, the Thornaby Trail Loop has 7 km of local walk within 2 km of the town. The regional route here is the Teesdale Way (Middleton in Teesdale to Middlesbrough).
Waymarked walks are OpenStreetMap walking routes. Public rights of way are only as complete as the map in each area.
When to get out
The best walking months in Ingleby Barwick: May to July and September
The town’s 1991–2020 averages (Met Office HadUK-Grid) and the daylight at its latitude. Outlined months have 12½+ hours of daylight, highs of 15 °C or more and little rain for the town.
Jan
Feb
Mar
Apr
May
Jun
Jul
Aug
Sep
Oct
Nov
Dec
Daylight (h)
7.8
9.6
11.7
14.0
16.0
17.2
16.7
14.9
12.6
10.4
8.3
7.3
High (°C)
7
8
10
13
16
18
21
20
18
14
10
7
Rain (mm)
44
42
36
43
44
66
55
81
58
58
65
53
March is the driest month (36 mm) and July the warmest (highs of 21 °C). Winter days are short, about 7 hours of daylight in December, and 81 mm of rain falls in August, the wettest month. Frost comes on about 46 nights a year. The climate in Ingleby Barwick →
Things to do
38 playgrounds and the nearest beaches
Mapped within 2 km of the town in OpenStreetMap, against the typical UK town its size per resident. Named places are listed with directions; unnamed ones are only counted.
Thornaby-on-Tees, 1.8 miles away, grades A, the best next door: 92% of its residents live within 400 m of a park.
Questions about the outdoors in Ingleby Barwick
What is the biggest park in Ingleby Barwick?
Preston Park, 35 ha (88 acres), with 5.8 km of path, just outside the built-up area. The Harold Wilson Recreation Centre (7.0 ha) is second. 4 named parks, gardens and playing fields are in the town or within 400 m of it.
Is Ingleby Barwick near a National Park?
Yes. North York Moors National Park begins 5.5 mi south-east of the town’s edge. It covers 1,441 km² and has been a National Park since 1952.
What are the best walks near Ingleby Barwick?
3 waymarked walking routes pass within 2 km of the town, including the Teesdale Way (Middleton in Teesdale to Middlesbrough), Thornaby Trail Loop and Thornaby Trail Connections. Preston Park alone has 5.8 km of path.
What is the nearest beach to Ingleby Barwick?
Coatham Sands, 11 mi from the edge of the town, then Middleton Beach (12 mi). Ingleby Barwick itself is inland.
How many people in Ingleby Barwick live near a park?
87% of residents live within 400 m, about a 5-minute walk, of a public park, garden or playing field (Census 2021 output areas against OS Open Greenspace). The typical UK town is 83%.
When is the best time of year for walking in Ingleby Barwick?
May to July and September: the longest days, the warmest afternoons and the least rain of the year, from the Met Office 1991–2020 averages.
Is Ingleby Barwick good for walking?
For paths, yes: 6.1 km of footpath and right of way per square kilometre, more than 98% of UK towns. For park space per person it beats 67% (2.9 ha per 1,000 residents).
How is the Outdoors Grade worked out?
From five measures, each placed among UK towns of 1,000 or more: public green space per resident, the share living near a park, National Park or National Landscape within 5 km, footpaths per square kilometre, and the sea within 5 km. It is a character grade and isn’t part of Ingleby Barwick’s overall grade.
Sources
Where Ingleby Barwick’s outdoors figures come from
National Parks and National Landscapes: Natural England and Natural Resources Wales boundaries, areas and designation dates, Open Government Licence v3.0.