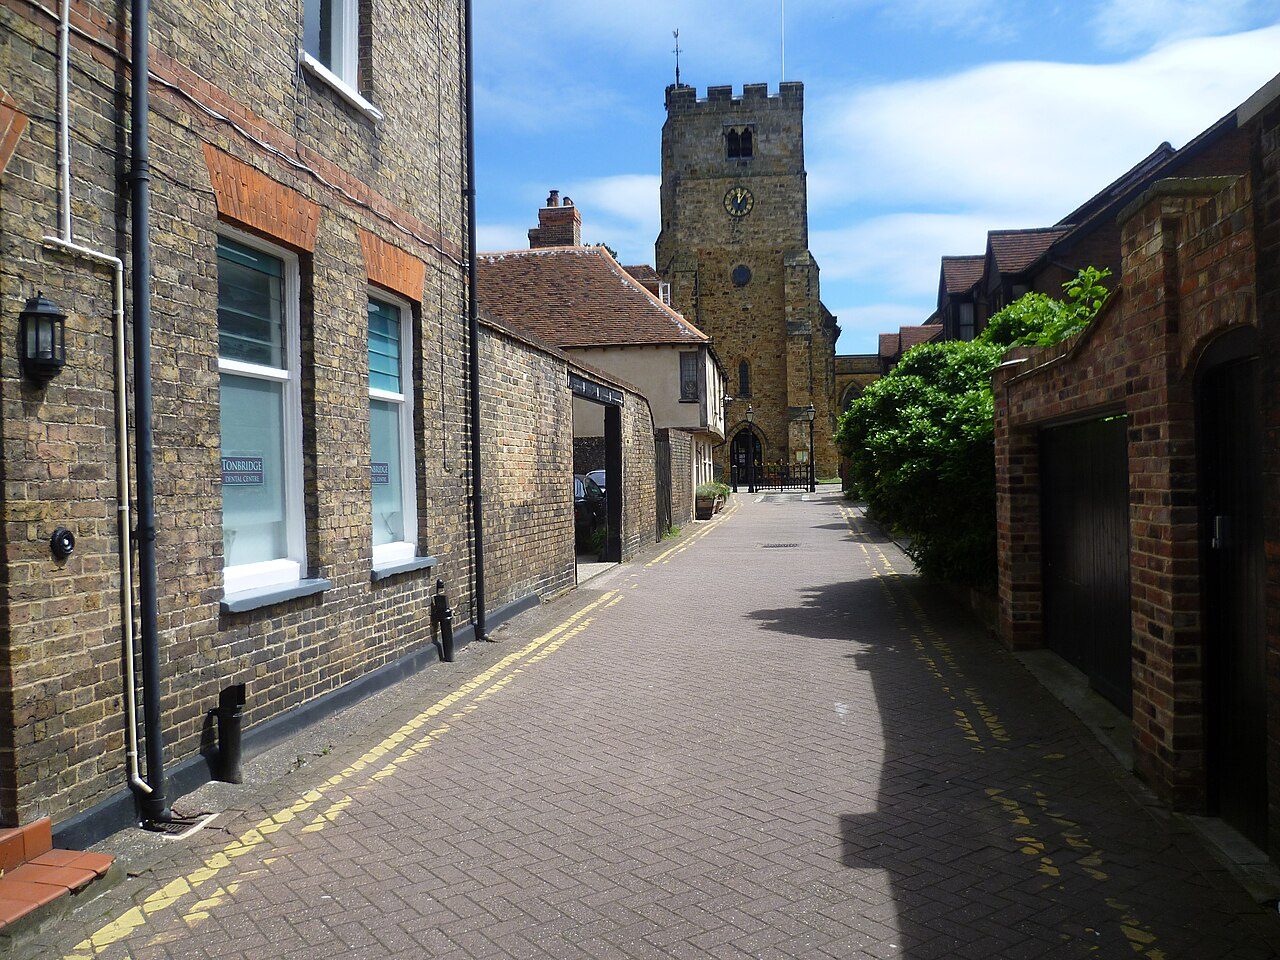
 Photo: Marathon · CC BY-SA 2.0
No party holds a majority on Tonbridge and Malling Borough Council
Tonbridge is run by Tonbridge and Malling Borough Council and Kent County Council. No party holds a majority on Tonbridge and Malling Borough Council. Reform UK has a majority on Kent County Council. Its MP is Tom Tugendhat (Conservative), member for Tonbridge.
£2,396
Band D, a year, the middle band every council sets its tax from.
Where it goes →How Tonbridge’s politics has changed since 2021
No majority on Tonbridge and Malling Borough Council
The Conservatives, the largest group, hold 20 of its 44 seats as elected, 3 short of the 23 needed. The Liberal Democrats hold 11, the Greens 8, Labour 3 and independents 2. Who’s in charge ↓
Kent in 2025
Kent County Council, which runs schools, social care and roads, has a Reform UK majority at the May 2025 election: Reform UK won 56 of 82 seats. Kent ↓
Council tax
A Band D bill in Tonbridge is £2,396 for 2026–27; Tonbridge and Malling Borough Council keeps 11% of it. The council area’s Band D has risen 55% in ten years, against England’s 56%. Council money ↓
Written from the data on this page: Democracy Club results since May 2021, the UK Parliament Members API and MHCLG council tax.
Who holds the seats on Tonbridge’s councils
Seats by party as elected. A party needs 23 of Tonbridge and Malling’s 44 or 42 of Kent’s 82 seats to run the council alone.
- Conservative20
- Liberal Democrat11
- Green8
- Labour3
- Independent2
Latest election: May 2023.
- Reform UK56
- Liberal Democrat12
- Conservative6
- Green6
- Labour2
Latest election: May 2025.
Seats are counted from election results: each ward’s most recent winners until its seats are filled. Councillors who have since changed party or resigned aren’t reflected, and which parties lead the council, and who is leader, comes from the council itself.
Results: Democracy Club (CC BY 4.0), elections since May 2021; seats per ward from its EveryElection.
Two tiers of council, no parish tier
Tonbridge has two tiers of council: the county runs the big services, the district the local ones.
Bins and recycling, planning, housing, environmental health, leisure, and collecting council tax.
Website ↗Schools, social care, roads and transport, libraries and waste disposal.
Website ↗Who to ask
From GOV.UK’s “Understand how your council works”: in two-tier areas the district or borough runs local services and the county the big ones.
All of Tonbridge is unparished: there is no parish or town council, so the council runs local matters itself and no parish precept is added to the bill.
Councils from ONS lookups (wards and councils May 2026, parishes 2025), names and websites from GOV.UK’s local council finder; parish councils from MHCLG’s 2026–27 list of precepting parishes.
From the council to Westminster
Every elected tier that speaks for Tonbridge, from the most recent elections.
- 1Tonbridge and Malling Borough Council5 wards · 12 councillorsGreen 7 · Liberal Democrat 3 · Conservative 3 · all 13
- 2Kent County Council1 division · 2 councillorsMark Antony James HoodPaul Andrew Stepto
- 3Police and crime commissionerKent Police · elected May 2024Matthew Scott
- 4House of CommonsTonbridge
Party colours are neutral on purpose: they tell parties apart and aren’t the parties’ own. Tap an MP’s name for their contact page on parliament.uk.
12 councillors for 5 wards
Wards with at least 2% of the town’s residents, or half their own inside it. Each shows who won its most recent elections, newest first, until its seats are filled.
- Anna Victoria CopeGreen · May 2023
- Robert William George OliverGreen · May 2023
- Bethan Alexandra ParryGreen · May 2023
- Frances Annabel HoskinsLiberal Democrat · May 2023
- Garry Christopher BridgeLiberal Democrat · May 2023
- James Anthony ClokeyLiberal Democrat · May 2023
- Stacey Dean PilgrimGreen · July 2024 · by-election
- Mark Antony James HoodGreen · May 2023
- George Benjamin HinesGreen · May 2023
- Lee AthwalGreen · May 2023
- Dennis KingConservative · May 2023
- Adem MehmetConservative · May 2023
- Keith Simon TunstallConservative · May 2023
Show as a table, with Kent County Council’s 1 division (2 councillors)
| Ward | Seats | Elected | When |
|---|---|---|---|
| Cage Green & Angelall in Tonbridge · 9,011 residents3 seats · May 2023 | 3 | Anna Victoria CopeRobert William George OliverBethan Alexandra Parry | May 2023 |
| Vauxhallall in Tonbridge · 8,313 residents3 seats · May 2023 | 3 | Frances Annabel HoskinsGarry Christopher BridgeJames Anthony Clokey | May 2023 |
| Juddall in Tonbridge · 6,945 residents2 seats · July 2024, May 2023 | 2 | Stacey Dean Pilgrimby-electionMark Antony James HoodGeorge Benjamin Hines | July 2024, May 2023 |
| Highamall in Tonbridge · 6,006 residents2 seats · May 2023 | 2 | Lee AthwalDennis King | May 2023 |
| Trenchall in Tonbridge · 5,861 residents2 seats · May 2023 | 2 | Adem MehmetKeith Simon Tunstall | May 2023 |
Kent County Council: county divisions
| Division | Seats | Elected | When |
|---|---|---|---|
| Tonbridge EDmostly in Tonbridge · 36,136 residents2 seats · May 2025 | 2 | Mark Antony James HoodPaul Andrew Stepto | May 2025 |
Councillors can resign, change party or sit as independents between elections; a by-election winner replaces someone not named here. Tonbridge and Malling Borough Council’s website lists who sits now.
Results from Democracy Club’s candidates database (CC BY 4.0; elections since May 2021) and ward seats from its EveryElection, matched to ONS wards (May 2026) and county divisions (May 2025).
Tonbridge and Malling council election, May 2023
Results in the wards that make up Tonbridge, as declared. Percentages are of votes cast for candidates in each ward; where a ward elects several councillors, each voter has that many votes.
5 wards voted. Every seat in the town’s wards was up.
No election is scheduled yet for Tonbridge’s wards in Democracy Club’s list. Councils publish a notice of election about five weeks before polling day.
Who can I vote for? ↗8,402 votes for candidates · 3 seats, so 3 votes each
6,516 votes for candidates · 3 seats, so 3 votes each
4,025 votes for candidates · 2 seats, so 2 votes each
Every ward’s result (2 more)
4,398 votes for candidates · 2 seats, so 2 votes each
3,302 votes for candidates · 2 seats, so 2 votes each
Candidates and results: Democracy Club (CC BY 4.0), from councils’ declared results; polling dates from Democracy Club’s EveryElection.
Tonbridge is in Tonbridge constituency
The constituency’s MP and the 4 July 2024 general election, the whole constituency’s result (it reaches beyond Tonbridge).
50,328 votes for candidates · majority 11,166
Conservative, MP since 7 May 2015.
turnout in July 2024: 50,328 votes from 72,799 registered voters. England: 60%.
Majority 11,166 of 50,328 votes (22.2%): wider than in 72% of England’s 543 constituencies.
MPs and results: UK Parliament Members API (Open Parliament Licence v3.0); constituencies from ONS (2024 boundaries). Percentages are of valid votes; turnout is votes cast over the electorate.
Tonbridge’s Band D council tax is £2,396 a year
Where a Band D bill goes, what it has cost over the years, and what the councils plan to spend per resident.
Tonbridge and Malling Borough Council keeps £252.65 of a Band D bill (11%); the rest goes to Kent County Council, the Kent police and crime commissioner and the Kent Fire and Rescue Authority.
Band D since 1993
Tonbridge and Malling’s Band D bill has risen 55% in ten years, from £1,597.03 in 2016–17, against England’s average (56%). It was £528.75 in 1993–94.
Your bill by band
A Band D home in the unparished part of Tonbridge and Malling, 2026–27, before discounts. The Valuation Office Agency’s band search gives any home’s band.
Kent’s councils
Average Band D in each council area, 2026–27, parish precepts included; the 11 nearest of 13. Bars start at £2,200.
Council budgets per resident, 2026–27
Show as a table, with Kent
| Tonbridge and Malling + Kent | Tonbridge’s councils | Kent | England |
|---|---|---|---|
| Adult social care | £505 | £492 | £487 |
| Children’s social care | £262 | £266 | £290 |
| Roads and transport | £56 | £49 | £41 |
| Housing (not council homes’ rents) | £35 | £41 | £61 |
| Bins, street cleaning, environment | £101 | £132 | £119 |
| Libraries, leisure, culture | £40 | £49 | £44 |
| Planning and development | £33 | £29 | £26 |
| Public health | £59 | £61 | £78 |
| Running the council | £81 | £74 | £59 |
| Other | £2 | £6 | £19 |
| Total, schools apart | £1,174 | £1,200 | £1,234 |
Net budgeted service spending, MHCLG Revenue Account budget 2026–27, per resident (ONS mid-2025 estimates). Both tiers added: Tonbridge and Malling per its residents plus Kent per the county’s. Schools are left out: academies are paid for directly by government, so council school budgets depend on how many schools have converted. Kent and England: all their councils together. Police, fire and transport authorities aren’t included.
Band D: MHCLG Band D council tax 2026–27 (each authority’s own figure, excluding parish precepts) and Council Tax statistics for town and parish councils 2026–27; since 1993–94, MHCLG’s area averages including parishes.
Having a say in how Tonbridge is run
It takes about five minutes online; the deadline is 12 working days before a poll.
gov.uk ↗Type a postcode to write to each of its councillors and its MP.
WriteToThem ↗GOV.UK sends the report to the council that looks after the road.
gov.uk ↗Council and committee meetings are open to the public, with agendas and minutes online.
tmbc.gov.uk ↗Anyone can comment while an application is open for consultation.
tmbc.gov.uk ↗The rules, nomination papers and guidance for council candidates.
Electoral Commission ↗Questions about how Tonbridge is run
Which council runs Tonbridge?
The county council runs schools, social care and roads; the district runs bins, planning and housing.
Does Tonbridge have a town council?
No. Tonbridge is unparished, so there is no town or parish council and no parish precept.
Who is the MP for Tonbridge?
Tom Tugendhat (Conservative) is the MP for Tonbridge, which covers Tonbridge.
How many councillors does Tonbridge have?
12 ward councillors represent Tonbridge’s 5 wards, and 2 county councillors its county divisions.
When are the next elections in Tonbridge?
No election is scheduled yet in Democracy Club’s list for Tonbridge’s wards. The next UK general election must be held by August 2029.
How much is council tax in Tonbridge?
Band D council tax in Tonbridge is £2,396 for 2026–27. Your bill depends on your home’s band, from A (6/9 of Band D) to H (18/9).
Who controls Tonbridge and Malling Borough Council?
No party has a majority. As elected, Conservative 20 · Liberal Democrat 11 · Green 8 · Labour 3 · Independent 2 of 44 seats; a majority needs 23. The council’s website lists who leads it now.
Who controls Kent County Council?
Reform UK has a majority: 56 of 82 seats as elected.
Who won the 2023 council election in Tonbridge?
In Tonbridge’s wards on 4 May 2023, Green 6 · Liberal Democrat 3 · Conservative 3 of the 12 seats up. The Greens had the largest share of votes, 45.6%.
Sources: ONS ward, county division, parish, constituency lookups (Census 2021 output areas; Open Government Licence v3.0) · GOV.UK local council finder · Democracy Club candidates (CC BY 4.0) and EveryElection · UK Parliament Members API (Open Parliament Licence v3.0) · MHCLG Band D council tax, parish precepts and Revenue Account budgets 2026–27 (OGL v3.0) · ONS mid-2025 population estimates. Contains public sector information licensed under the Open Government Licence v3.0. Contains Parliamentary information licensed under the Open Parliament Licence v3.0.
Contains public sector information licensed under the Open Government Licence v3.0. Contains HM Land Registry data © Crown copyright and database right 2026. Contains OS data © Crown copyright and database right 2026 (ONS boundaries). Northern Ireland: Source: NISRA; contains Land & Property Services data and Ordnance Survey of Northern Ireland information, © Crown copyright, licensed under the Open Government Licence v3.0. Scotland: contains National Records of Scotland data, Registers of Scotland data and SEPA data, © Crown copyright / © SEPA 2025, licensed under the Open Government Licence v3.0.