



St Chad's Patchway CofE Primary School
Patchway, BS34 6AQ · South Gloucestershire local authority
Patchway’s School Grade B better than 58% of towns in England
What stands out about St Chad's Patchway CofE Primary School
- Its own letter, B−: Key Stage 2 results better than 45% of England’s primary schools
- Room to spare: 167 pupils for 240 places
- 14% of pupils are eligible for free school meals (fewer than England’s 25%)
- Ofsted: Good, June 2024 (shown, not graded)
- Every family who put it first got a place for September 2026 (14 of 14)
- Homes in its postcode sector (BS34 6) sold for a median £320,000; Patchway’s is £315,000
Results
DfE · Key Stage 2Reading, writing and maths 61%
Met the expected standard, DfE’s 3-year average 2023–2025 · higher than 45% of England’s 14,979 graded primaries · South Gloucestershire avg 61%
Each subject, 2025
Met the expected standard; the mark is England’s schools · average scaled score: reading 106, maths 103 (100 = the expected standard)
England’s figures are of its graded mainstream state schools, each school counted once; grammar schools are included, which is why the right-hand tail is long. Small cohorts are suppressed.
How hard is it to get a place at St Chad's Patchway CofE Primary School?
Every family who put it first got a place for September 2026.
Years when some first choices missed out: 2019 (3). The council runs the coordinated admissions; each school’s rules (siblings, distance, faith) decide who gets in. DfE doesn’t publish the furthest distance offered, so check the council’s admissions booklet for that. South Gloucestershire council sets the admissions rules. Apply through South Gloucestershire council’s coordinated admissions.
Outline = places offered · green = families who put it first · striped = more first choices than places
100% got their first choice
Patchway and South Gloucestershire, side by side
2023–2025All 84 graded primaries in South Gloucestershire. Schools with more pupils on free school meals usually score lower, so a school above the crowd for its free school meals is doing better than its intake predicts. Patchway’s schools are coloured by their letter.
Show as a table
| School | Letter | Free school meals | KS2 expected standard |
|---|---|---|---|
| Hambrook Primary School | A+ | 3% | 91% |
| Marshfield Church of England Primary School | A+ | 4% | 91% |
| Frampton Cotterell Church of England Primary School | A+ | 8% | 87% |
| Beacon Rise Primary School | A+ | 12% | 85% |
| Coniston Primary School | A | 38% | 82% |
| Wick Church of England Primary School | A | 10% | 77% |
| St Michael's Church of England Primary School, Winterbourne | A | 16% | 76% |
| Iron Acton Church of England Primary School | A | 19% | 76% |
| Christ Church, Church of England Junior School, Downend | A− | 9% | 73% |
| Manorbrook Primary School | A− | 7% | 73% |
| Bradley Stoke Community School | A− | 12% | 73% |
| Mangotsfield Church of England Primary School | A− | 9% | 73% |
| Olveston Church of England Primary School | A− | 4% | 72% |
| Frenchay Church of England Primary School | A− | 14% | 72% |
| Pucklechurch CofE VC Primary School | A− | 12% | 71% |
| Wallscourt Farm Academy | A− | 22% | 71% |
| Holy Trinity Primary School | B+ | 4% | 70% |
| Watermore Primary School | B+ | 21% | 70% |
| The Meadows Primary School | B+ | 7% | 70% |
| Blackhorse Primary School | B+ | 7% | 70% |
| Wheatfield Primary School | B+ | 7% | 70% |
| Hawkesbury Church of England Primary School | B+ | 7% | 70% |
| Crossways Junior School | B+ | 15% | 70% |
| Meadowbrook Primary School | B+ | 15% | 69% |
| Holy Family Catholic Primary School | B+ | 16% | 68% |
| Hanham Abbots Junior School | B+ | 13% | 68% |
| Kings' Forest Primary School | B+ | 17% | 68% |
| The Park Primary School | B+ | 21% | 68% |
| Bromley Heath Junior School | B | 1% | 67% |
| Almondsbury Church of England Primary School | B | 7% | 67% |
| Oldbury on Severn Church of England Primary School | B | 18% | 67% |
| The Manor Church of England Primary School | B | 14% | 67% |
| Abbotswood Primary School | B | 25% | 67% |
| Raysfield Primary School | B | 17% | 67% |
| Cherry Garden Primary School | B | 13% | 66% |
| Barrs Court Primary School | B | 13% | 66% |
| Bailey's Court Primary School | B | 10% | 65% |
| St Mary's Catholic Primary School | B | 6% | 65% |
| Charfield Primary School | B− | 10% | 64% |
| Trinity Church of England Primary School | B− | 7% | 63% |
| Stoke Lodge Primary School | B− | 16% | 63% |
| Stanbridge Primary School | B− | 10% | 63% |
| Woodlands Primary School | B− | 26% | 62% |
| Emersons Green Primary School | B− | 13% | 62% |
| St Chad's Patchway CofE Primary School | B− | 14% | 61% |
| The Ridge Junior School | B− | 16% | 61% |
| Alexander Hosea Primary School | C+ | 6% | 60% |
| St Anne's Church of England Primary School | C+ | 13% | 60% |
| St Michael's Church of England Primary School, Stoke Gifford | C+ | 12% | 59% |
| North Road Community Primary School | C+ | 11% | 58% |
| Longwell Green Primary School | C+ | 7% | 58% |
| Wellesley Primary School | C+ | 8% | 58% |
| St Paul's Catholic Primary School | C+ | 19% | 58% |
| St Stephen's Church of England Junior School, Soundwell | C+ | 20% | 58% |
| The Tynings Primary School | C | 21% | 57% |
| Courtney Primary School | C | 18% | 56% |
| Christ Church Hanham CofE Primary School | C | 10% | 56% |
| Staple Hill Primary School | C | 30% | 56% |
| Lyde Green Primary School | C | 22% | 55% |
| St John's Mead Church of England Primary School | C | 12% | 54% |
| Christ The King Catholic Primary School, Thornbury | C | 18% | 54% |
| Charborough Road Primary School | C− | 14% | 53% |
| Redfield Edge Primary School | C− | 4% | 53% |
| St Barnabas Church of England Primary School | C− | 14% | 52% |
| Shield Road Primary School | C− | 29% | 51% |
| Elm Park Primary School | C− | 29% | 51% |
| Bowsland Green Primary School | C− | 8% | 51% |
| Horton CofE VA Primary School | C− | 35% | 50% |
| Gillingstool Primary School | C− | 29% | 50% |
| St Augustine of Canterbury Catholic Primary School | C− | 19% | 49% |
| St Peter's Anglican / Methodist VC Primary | C− | 10% | 49% |
| Severn Beach Primary School | C− | 14% | 49% |
| Filton Hill Primary School | C− | 20% | 48% |
| King's Oak Academy | D | 29% | 45% |
| Barley Close Community Primary School | D | 32% | 44% |
| Parkwall Primary School | D | 51% | 44% |
| Callicroft Primary School | D | 32% | 43% |
| Cadbury Heath Primary School | D | 19% | 42% |
| St Mary's Church of England Primary School, Thornbury | D | 11% | 39% |
| Tyndale Primary School | D− | 49% | 38% |
| Our Lady of Lourdes Catholic Primary School | D− | 24% | 35% |
| Little Stoke Primary School | D− | 31% | 33% |
| St Andrew's Church of England Primary School, Cromhall | D− | 15% | 30% |
| Tortworth Primary School | D− | 26% | 29% |
Who goes here
DfE school census, January 2025169 pupils. SEN support is extra help in school for a special educational need; an EHC plan is the council’s legal plan for pupils who need more.
Girls and boys
St Chad's Patchway CofE Primary School’s letter
Its own results against England’s schools, not the town’s School Grade.
How school letters are worked out
Each school’s measure is compared with every graded school in England of the same phase: for primaries, the share of pupils meeting the expected standard in reading, writing and maths (DfE’s three-year average); for secondaries, Attainment 8 and the share with grade 5 or above in English and maths, each turned into a z-score against England’s schools and averaged. The letter comes from the share of those schools it beats, in the same bands as every grade on the site. The same method gives U.S. schools their letters, against their own state.
Graded: England’s open mainstream state schools with published results (grammar schools included, which select by test). Not graded: special schools, alternative provision, nurseries, 16–19 colleges, UTCs and studio schools, Welsh schools. Ofsted plays no part.
Ofsted inspections
Shown, not graded: Ofsted is never part of a letter or the School Grade.
Graded inspection: Good, June 2024.
Living near St Chad's Patchway CofE Primary School
For families thinking of moving: what homes cost around the school, and the other schools close by.
Home prices in BS34 6, the school’s postcode sector
Patchway property prices →Median sale price each year, 2010 to 2025
By type, the 36 months to August 2026
Homes in BS34 6 sell for about the same as Patchway’s typical price. HM Land Registry Price Paid, standard sales. Catchments aren’t published, so the postcode sector stands in for “around the school”.
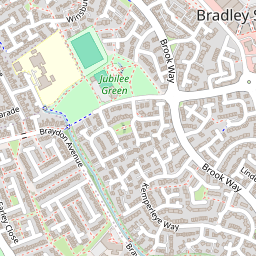
Schools within 1.6 miles
17 state schoolsLocation
Directions ↗Patchway, BS34 6AQ
St Chad's Patchway CofE Primary School: common questions
Is St Chad's Patchway CofE Primary School a good school?
By its published results, about average: its Key Stage 2 results are better than 45% of England’s primary schools (its letter is B−), with 61% of pupils meeting the expected standard in reading, writing and maths, against 62% for England’s schools. Ofsted: Good, June 2024.
How hard is it to get into St Chad's Patchway CofE Primary School?
For September 2026, 14 families put St Chad's Patchway CofE Primary School first and all of them were offered a place; 14 places were offered in all.
What is St Chad's Patchway CofE Primary School’s Ofsted rating?
Its latest inspection outcome is Good (June 2024).
How much do houses cost near St Chad's Patchway CofE Primary School?
Homes in its postcode sector, BS34 6, sold for a median £320,000 over the 36 months to August 2026 (230 sales).
Sources: DfE Get Information about Schools (16 October 2026), Key Stage 2 performance tables (2023–2025, three-year average) and Key Stage 4 (2025/26, provisional); Ofsted state-funded school inspections as at 30 September 2026. All under the Open Government Licence v3.0.
Also: DfE Key Stage 4 performance, schools data (2023/24 and 2024/25 final, 2025/26 provisional) and Key Stage 2 performance tables 2024/25 by subject; DfE school census, January 2025; DfE school-level applications and offers, September 2019 to 2026 entry; HM Land Registry Price Paid by postcode sector, 2010 to August 2026.
A school’s letter is our own summary of its published results against England’s schools of the same phase; Patchway’s School Grade is a separate grade, built from the results of the schools in and around the town against other towns. Map: © OpenStreetMap contributors.
Contains public sector information licensed under the Open Government Licence v3.0. Contains HM Land Registry data © Crown copyright and database right 2026. Contains OS data © Crown copyright and database right 2026 (ONS boundaries). Northern Ireland: Source: NISRA; contains Land & Property Services data and Ordnance Survey of Northern Ireland information, © Crown copyright, licensed under the Open Government Licence v3.0. Scotland: contains National Records of Scotland data, Registers of Scotland data and SEPA data, © Crown copyright / © SEPA 2025, licensed under the Open Government Licence v3.0.