Guest, Sign inJoin
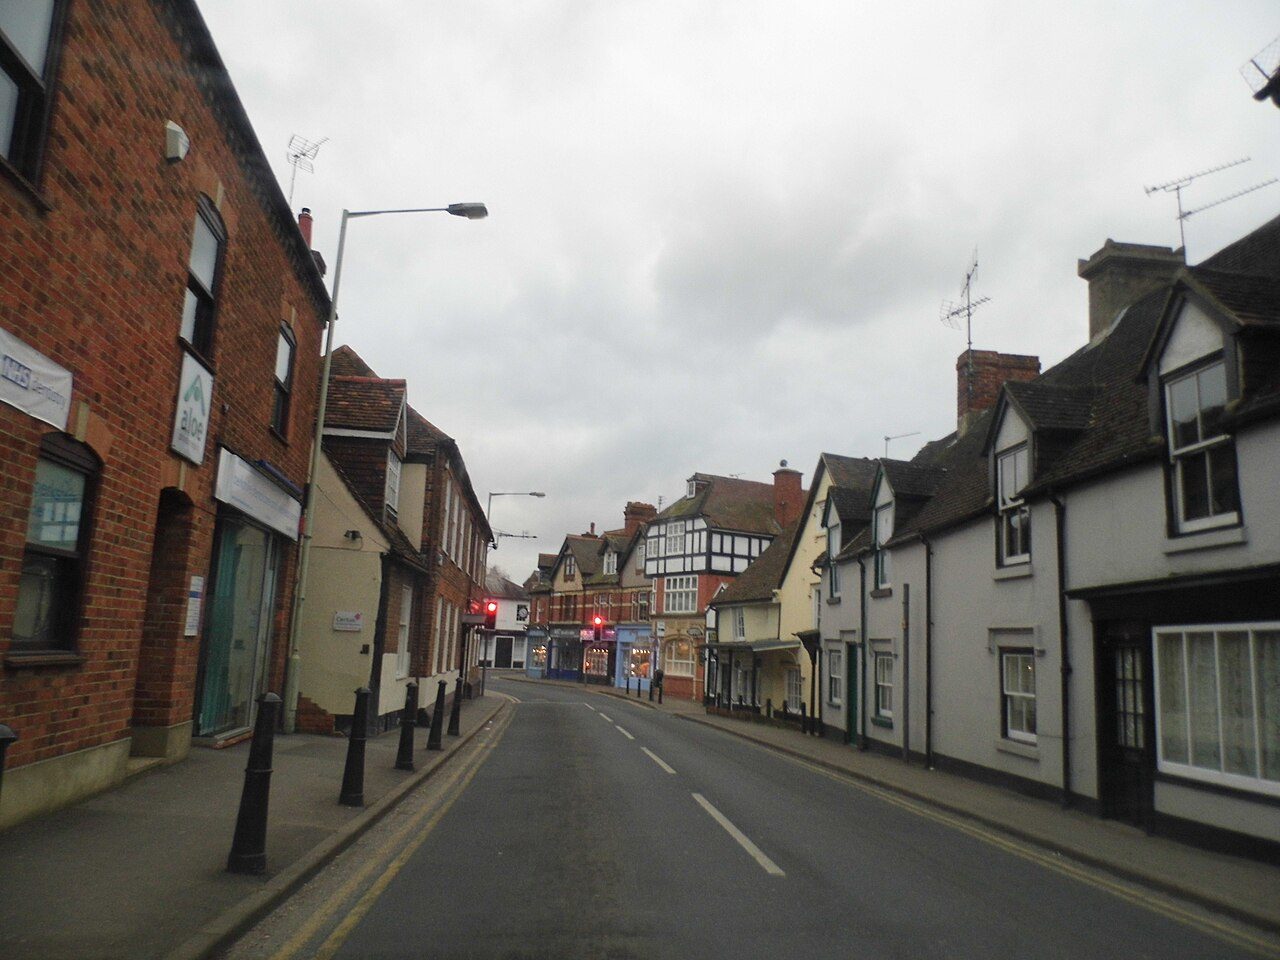
High Street TwyfordPhoto: David Howard · CC BY-SA 2.0
B−Outdoors Grade
Outdoors in Twyford · parks, paths & countryside

86% of Twyford’s residents live within a 5-minute walk of a park

The Chilterns National Landscape begins 1.6 mi from the town’s edge. Footpaths add up to 31 km in the town and the kilometre around it, 2.1 for every square kilometre. Parks and playing fields in Twyford add up to 2.4 ha for every 1,000 residents; the typical UK town has 2.1. Twyford grades B− for the outdoors: #23 of 30 in Berkshire. A character grade: it isn’t part of the overall grade.

Green space
2.4 ha
per 1,000 residents
Typical UK town 2.1
Near a park
86%
of residents within 400 m
Typical UK town 83%
Footpaths
31 km
2.1 km per km², town + 1 km
Typical UK town 3.0 per km²
Protected landscape
5%
of the land within 5 km
Nearest: Chilterns National Landscape
Character

What kind of outdoors town is Twyford?

Read from the data: what stands out first, good and bad.

Twyford’s strongest suit is the Chilterns National Landscape close by, followed by the European walking route E2 west, UK, South East England.

Outdoors grade

Twyford grades B− for the outdoors

Each chart is every UK town of 1,000 or more on one measure: the green bar is Twyford, the dashed line the typical town. The number is the share of towns it beats; the five are averaged and the average ranked again.

B−
Better than 52% of UK towns#23 of 30 in Berkshire · 31st of 60 UK towns its size
Public green space2.4 haper 1,000 residents: parks, gardens, playing fields, play spaces
typical 2.1 ha010+
56out of
100
A park within a walk86%of residents within 400 m (a 5-minute walk)
typical 83%0100+
59out of
100
National Park or National Landscape5%of the land within 5 km
none100+
67out of
100
Footpaths2.1 kmper km², the town and 1 km around it
typical 3.0 km010+
33out of
100
The sea0%of the area within 5 km · Inland
none80+
42out of
100

Graded, never part of the overall grade (like History and Civic life). It measures what is mapped: OS Open Greenspace leaves out woodland and open-access land that isn’t a park, and OpenStreetMap’s rural paths are more complete in some places than others.

Towns its size

Twyford is 31st of 60 UK towns its size for the outdoors

The 60 UK towns and cities of 7,700 to 8,500 people with an Outdoors Grade. Hover a dot for its figures; tap one for its page.

0255075100Ashford Common (Surrey): D · 0.8 ha green space per 1,000 · 62% near a park · 2.5 km path per km²Swaffham (Norfolk): D · 1 ha green space per 1,000 · 68% near a park · 2.6 km path per km²Clowne (Derbyshire): C− · 1.4 ha green space per 1,000 · 67% near a park · 2.8 km path per km²Highworth (Wiltshire): C− · 0.4 ha green space per 1,000 · 59% near a park · 4.1 km path per km²Cotgrave (Nottinghamshire): C− · 1 ha green space per 1,000 · 47% near a park · 4.1 km path per km²Penkridge (Staffordshire): C− · 0.8 ha green space per 1,000 · 70% near a park · 2.1 km path per km²Launceston (Cornwall): C− · 2.1 ha green space per 1,000 · 66% near a park · 0.9 km path per km²Tenterden (Kent): C− · 0.8 ha green space per 1,000 · 58% near a park · 1.8 km path per km²Rainworth (Nottinghamshire): C− · 0.5 ha green space per 1,000 · 65% near a park · 4.6 km path per km²Radlett (Hertfordshire): C− · 2.1 ha green space per 1,000 · 60% near a park · 2.7 km path per km²Hilton (Derbyshire): C− · 1.1 ha green space per 1,000 · 89% near a park · 2.4 km path per km²Llanharan and Brynna (Mid Glamorgan): C− · 1.7 ha green space per 1,000 · 97% near a park · 1.2 km path per km²Glastonbury (Somerset): C− · 2 ha green space per 1,000 · 69% near a park · 2.6 km path per km²Hedon (East Riding of Yorkshire): C− · 0.9 ha green space per 1,000 · 74% near a park · 2.1 km path per km²Gerrards Cross (Buckinghamshire): C · 2.1 ha green space per 1,000 · 38% near a park · 2.3 km path per km²Histon and Impington (Cambridgeshire): C · 1.5 ha green space per 1,000 · 66% near a park · 3.9 km path per km²Southam (Warwickshire): C · 2.3 ha green space per 1,000 · 86% near a park · 1.7 km path per km²Norton-on-Derwent (North Yorkshire): C · 1.6 ha green space per 1,000 · 58% near a park · 2.4 km path per km²Silsden (West Yorkshire): C · 0.8 ha green space per 1,000 · 67% near a park · 3.5 km path per km²Holywell (Clwyd): C · 0.9 ha green space per 1,000 · 68% near a park · 3 km path per km²Ammanford (Dyfed): C+ · 2.8 ha green space per 1,000 · 70% near a park · 1.5 km path per km²Seaton Delaval (Northumberland): C+ · 0.5 ha green space per 1,000 · 66% near a park · 4 km path per km²Crediton (Devon): C+ · 2.4 ha green space per 1,000 · 89% near a park · 2.4 km path per km²Bewdley (Worcestershire): C+ · 1.7 ha green space per 1,000 · 88% near a park · 3.3 km path per km²Ystalyfera (West Glamorgan): C+ · 2.6 ha green space per 1,000 · 84% near a park · 0.8 km path per km²Fakenham (Norfolk): C+ · 5.2 ha green space per 1,000 · 81% near a park · 2 km path per km²Buntingford (Hertfordshire): C+ · 1.5 ha green space per 1,000 · 95% near a park · 3.2 km path per km²Denbigh (Clwyd): B− · 1.3 ha green space per 1,000 · 96% near a park · 2.3 km path per km²Meltham (West Yorkshire): B− · 1 ha green space per 1,000 · 63% near a park · 5.3 km path per km²Twyford (Berkshire): B− · 2.4 ha green space per 1,000 · 86% near a park · 2.1 km path per km²Alnwick (Northumberland): B− · 2.2 ha green space per 1,000 · 67% near a park · 3.4 km path per km²Ashley (Hampshire): B · 2.2 ha green space per 1,000 · 53% near a park · 1.7 km path per km²Clayton-le-Moors (Lancashire): B · 1.1 ha green space per 1,000 · 86% near a park · 4.2 km path per km²Rusthall and Langton Green (Kent): B · 2.1 ha green space per 1,000 · 69% near a park · 2.7 km path per km²Edenbridge (Kent): B · 2.6 ha green space per 1,000 · 64% near a park · 3 km path per km²Pershore (Worcestershire): B · 2.7 ha green space per 1,000 · 76% near a park · 3.2 km path per km²Runwell (Essex): B+ · 5.1 ha green space per 1,000 · 92% near a park · 2.8 km path per km²Coppull (Lancashire): B+ · 4.6 ha green space per 1,000 · 85% near a park · 3.7 km path per km²Annfield Plain (County Durham): B+ · 3.4 ha green space per 1,000 · 93% near a park · 3.7 km path per km²Pembroke (Dyfed): B+ · 2.2 ha green space per 1,000 · 91% near a park · 1 km path per km²Cam (Gloucestershire): A− · 2.8 ha green space per 1,000 · 57% near a park · 5 km path per km²City of London (London): A− · 2 ha green space per 1,000 · 100% near a park · 11 km path per km²Burnham-on-Crouch (Essex): A− · 5.3 ha green space per 1,000 · 86% near a park · 2.5 km path per km²London Colney (Hertfordshire): A− · 3.7 ha green space per 1,000 · 96% near a park · 4.3 km path per km²Dinas Powis (South Glamorgan): A− · 3 ha green space per 1,000 · 73% near a park · 4.5 km path per km²Norton Canes (Staffordshire): A− · 13.3 ha green space per 1,000 · 97% near a park · 1.9 km path per km²Richmond (North Yorkshire): A · 2.4 ha green space per 1,000 · 96% near a park · 3.9 km path per km²Bursledon (Hampshire): A · 2.6 ha green space per 1,000 · 90% near a park · 3.8 km path per km²Stonehouse (Gloucestershire): A · 1.8 ha green space per 1,000 · 94% near a park · 4.6 km path per km²Bearsted (Kent): A · 5.5 ha green space per 1,000 · 76% near a park · 3.5 km path per km²Ledbury (Herefordshire): A · 3.3 ha green space per 1,000 · 89% near a park · 3.1 km path per km²Brecon (Powys): A · 3.2 ha green space per 1,000 · 86% near a park · 3.2 km path per km²East Cowes (Isle of Wight): A · 1.4 ha green space per 1,000 · 96% near a park · 3 km path per km²Grove (Oxfordshire): A · 2.2 ha green space per 1,000 · 92% near a park · 4.7 km path per km²Dursley (Gloucestershire): A · 1.8 ha green space per 1,000 · 90% near a park · 7.2 km path per km²Bargod (Gwent): A · 13.6 ha green space per 1,000 · 100% near a park · 5.5 km path per km²Stakeford (Northumberland): A+ · 10 ha green space per 1,000 · 100% near a park · 2.9 km path per km²Ecclesfield and Grenoside (South Yorkshire): A+ · 5.1 ha green space per 1,000 · 94% near a park · 5.2 km path per km²Chipping Sodbury (Gloucestershire): A+ · 5.2 ha green space per 1,000 · 93% near a park · 8.2 km path per km²Upton (Dorset): A+ · 9.1 ha green space per 1,000 · 84% near a park · 4.7 km path per km²Twyford
Outdoors score: the share of UK towns each one beats
Footpath, km per km²
Twyford2.1
Towns its size3.1
Berkshire towns3.1
All UK towns3.0
Green space, ha per 1,000 residents
Twyford2.4
Towns its size2.1
Berkshire towns2.9
All UK towns2.1
Residents within 400 m of a park
Twyford86%
Towns its size84%
Berkshire towns81%
All UK towns83%

Against towns its size, Twyford stands out most for park space per resident: only 22 of the other 59 have more. It falls furthest behind on path per km², where 48 of the others do better.

Show as a table
TownOutdoorsGreen spaceNear a parkPath per km²Protected
1Upton DorsetA+9.184%4.718%
2Chipping Sodbury GloucestershireA+5.293%8.229%
3Ecclesfield and Grenoside South YorkshireA+5.194%5.22%
4Stakeford NorthumberlandA+10100%2.90%
5Bargod GwentA13.6100%5.50%
6Dursley GloucestershireA1.890%7.252%
7Grove OxfordshireA2.292%4.727%
8Brecon PowysA3.286%3.261%
9East Cowes Isle of WightA1.496%38%
10Ledbury HerefordshireA3.389%3.134%
11Bearsted KentA5.576%3.539%
12Stonehouse GloucestershireA1.894%4.636%
13Bursledon HampshireA2.690%3.80%
14Richmond North YorkshireA2.496%3.97%
15Norton Canes StaffordshireA−13.397%1.910%
16Dinas Powis South GlamorganA−373%4.50%
17London Colney HertfordshireA−3.796%4.30%
18Burnham-on-Crouch EssexA−5.386%2.50%
19City of London LondonA−2100%110%
20Cam GloucestershireA−2.857%534%
21Pembroke DyfedB+2.291%131%
22Annfield Plain County DurhamB+3.493%3.70%
23Coppull LancashireB+4.685%3.70%
24Runwell EssexB+5.192%2.80%
25Pershore WorcestershireB2.776%3.27%
26Edenbridge KentB2.664%342%
27Rusthall and Langton Green KentB2.169%2.779%
28Clayton-le-Moors LancashireB1.186%4.22%
29Ashley HampshireB2.253%1.747%
30Alnwick NorthumberlandB−2.267%3.47%
31Twyford BerkshireB−2.486%2.15%
32Meltham West YorkshireB−163%5.327%
33Denbigh ClwydB−1.396%2.35%
34Buntingford HertfordshireC+1.595%3.20%
35Fakenham NorfolkC+5.281%20%
36Ystalyfera West GlamorganC+2.684%0.815%
37Bewdley WorcestershireC+1.788%3.30%
38Crediton DevonC+2.489%2.40%
39Seaton Delaval NorthumberlandC+0.566%40%
40Ammanford DyfedC+2.870%1.59%
41Holywell ClwydC0.968%30%
42Silsden West YorkshireC0.867%3.51%
43Norton-on-Derwent North YorkshireC1.658%2.416%
44Southam WarwickshireC2.386%1.70%
45Histon and Impington CambridgeshireC1.566%3.90%
46Gerrards Cross BuckinghamshireC2.138%2.32%
47Hedon East Riding of YorkshireC−0.974%2.10%
48Glastonbury SomersetC−269%2.60%
49Llanharan and Brynna Mid GlamorganC−1.797%1.20%
50Hilton DerbyshireC−1.189%2.40%
51Radlett HertfordshireC−2.160%2.70%
52Rainworth NottinghamshireC−0.565%4.60%
53Tenterden KentC−0.858%1.848%
54Penkridge StaffordshireC−0.870%2.17%
55Launceston CornwallC−2.166%0.91%
56Cotgrave NottinghamshireC−147%4.10%
57Highworth WiltshireC−0.459%4.10%
58Clowne DerbyshireC−1.467%2.80%
59Swaffham NorfolkD168%2.60%
60Ashford Common SurreyD0.862%2.50%
The map

Parks, footpaths & countryside

Tap a number to zoom to a park. Tap a layer to hide it. The dashed line is Twyford’s built-up area.

12345
Green space: parks, gardens, playing fields and play spaces, named or not.© OpenStreetMap contributors · Contains OS data © Crown copyright · Natural England / NRW
Places to walk

Parks to walk in, in and around Twyford

The biggest is Stanlake Meadow Recreation Ground, 7.0 ha (17 acres). Directions go to the park’s nearest public entrance where Ordnance Survey maps one.

All 5 named parks by size: 13 ha (33 acres) and 2 km of pathStanlake Meadow Recreation Ground7.0 ha · 0.9 km of pathStanlake Meadow Recreation Ground: 7.0 ha, 0.9 km of pathKing George's Field6.2 ha · 0.9 km of pathKing George's Field: 6.2 ha, 0.9 km of pathHurst Park: 0.1 haWaltham Chase Play Area: 0.1 haJubilee Corner: 0.0 ha
Parks & gardens 0.0 haPlaying fields 13 haPlay spaces 0.1 ha

The two biggest, Stanlake Meadow Recreation Ground and King George's Field, are 99% of the named green space. 3 of the 5 are under 2 ha: small gardens, play spaces and pitches.

Twyford’s biggest

Stanlake Meadow Recreation Ground

Playing field
7.0 ha (17 acres)0.9 km of path
10 minto walk all 0.9 km of path
10 pitchesfootball pitches would fit
Centralin the middle of Twyford
Directionsto the nearest entrance

King George's Field

Playing field
6.2 ha (15 acres)0.9 km of path
10 minto walk all 0.9 km of path
9 pitchesfootball pitches would fit
Centralin the middle of Twyford
Directionsto the nearest entrance

Hurst Park

Play space
0.1 ha (0 acres)
0.5 mi southfrom the centre
Directionsto the nearest entrance

Jubilee Corner

Park or garden
0.0 ha (0 acres)
Centralin the middle of Twyford
Directionsto the nearest entrance

Waltham Chase Play Area

Play space
0.1 ha (0 acres)
0.6 mi south-eastfrom the centre
Directionsto the nearest entrance
Close to home

How close Twyford’s homes are to a park

Each square is 1 in 100 residents: green lives within 400 m of a public park, garden or playing field (Census 2021 output areas against OS Open Greenspace).

Within 400 m (86%)Further (14%)
Twyford86%
Towns its size84%
Berkshire towns81%
All UK towns83%

About 1,100 people live further than that. Playing fields count, so a park within reach isn’t always one with paths or trees; 20 playgrounds are mapped in and around the town, about one for every 404 residents.

National Parks & National Landscapes

The Chilterns National Landscape is 1.6 mi away

Protected landscapes within 30 km, by direction and distance from the edge of the built-up area; circle size shows each one’s area. National Landscapes were called Areas of Outstanding Natural Beauty until 2023.

4.5 mi9 mi13.5 mi18 miNChilterns1.6 mi north-westChilterns National Landscape: 1.6 mi north-west of Twyford’s edge · 838 km² · since 1990North Wessex Downs7.1 mi westNorth Wessex Downs National Landscape: 7.1 mi west of Twyford’s edge · 1,731 km² · since 1972Surrey Hills17 mi southSurrey Hills National Landscape: 17 mi south of Twyford’s edge · 422 km² · since 1958Twyford
National ParkNational LandscapeThe 5 km the grade counts
National Landscape

Chilterns

1.6 mi north-west838 km²since 19905% of the land within 5 km
Official site
National Landscape

North Wessex Downs

7.1 mi west1,731 km²since 1972
Official site
National Landscape

Surrey Hills

17 mi south422 km²since 1958
Official site

5% of the land within 5 km of Twyford is National Park or National Landscape, more than 67% of UK towns.

Footpaths & waymarked walks

Twyford is on the European walking route E2 west, UK, South East England

31 km of footpaths, bridleways and rights of way are mapped in Twyford and the kilometre around it, 2.1 km for every square kilometre (the typical UK town has 3.0). Bars show each route’s kilometres within 2 km of the town.

NationalRegional
The Wokingham Way7.3 km
European walking route E2 west, UK, South East England5.5 km
Thames Path5.5 km

The European walking route E2 west, UK, South East England, a national route, passes Twyford. The regional route here is the The Wokingham Way.

Waymarked walks are OpenStreetMap walking routes. Public rights of way are only as complete as the map in each area.

When to get out

The best walking months in Twyford: May to September

The town’s 1991–2020 averages (Met Office HadUK-Grid) and the daylight at its latitude. Outlined months have 12½+ hours of daylight, highs of 15 °C or more and little rain for the town.

JanFebMarAprMayJunJulAugSepOctNovDec
Daylight (h)8.39.911.713.815.616.616.214.612.510.58.87.9
High (°C)891114182023222015118
Rain (mm)664542494548485753747466

March is the driest month (42 mm) and July the warmest (highs of 23 °C). Winter days are short, about 8 hours of daylight in December, and 74 mm of rain falls in November, the wettest month. Frost comes on about 46 nights a year. The climate in Twyford →

Things to do

2 viewpoints, 20 playgrounds and the nearest beaches

Mapped within 2 km of the town in OpenStreetMap, against the typical UK town its size per resident. Named places are listed with directions; unnamed ones are only counted.

The nearest beaches

Twyford is inland. These are the nearest named beaches, measured from the edge of the town.

Amity Beach15 mi from Twyford’s edge
Directions
Penguin Beach20 mi from Twyford’s edge
Directions
Hog Hole24 mi from Twyford’s edge
Directions
The Hollows24 mi from Twyford’s edge
Directions
Good to know

Check the water before you swim. The Environment Agency tests designated bathing waters from May to September and publishes a rating for each beach.

Every named place, with directions

Viewpoints 2

Ancient Oak Tree0.1 mi from town
Directions

Plus 1 viewpoint without a name on the map.

Hills and peaks 1

Warren Hill1.1 mi from town
Directions

Nature reserves 1

Loddon Nature Reserve13 ha · 0.1 mi from town
Directions

Playgrounds 20

Park Lane Recreation Ground0.7 mi from town
Directions

Plus 19 playgrounds without a name on the map.

Slipways 2

Plus 2 slipways without a name on the map.

Next door

The outdoors in nearby towns

The nearest towns of 1,000+ within 12 miles. Tap a town for its outdoors page.

ABCDOutdoors Grade
TownOutdoorsGreen space, ha per 1,000Near a parkProtected within 5 km
TwyfordB−2.486%5%
Charvil 1.0 miC−0.768%6%
Hurst 1.3 miC−5.168%0%
Wargrave 1.7 miA−4.0100%11%
Sonning 2.1 miA−11.180%7%
Woodley 2.4 miA5.081%1%
Lower Shiplake 2.6 miC+3.00%28%

Woodley, 2.4 miles away, grades A, the best next door: 81% of its residents live within 400 m of a park. Hurst, Sonning and Woodley have at least twice Twyford’s green space per resident.

Questions about the outdoors in Twyford

What is the biggest park in Twyford?

Stanlake Meadow Recreation Ground, 7.0 ha (17 acres), with 0.9 km of path. King George's Field (6.2 ha) is second. 5 named parks, gardens and playing fields are in the town or within 400 m of it.

Is Twyford near a National Park?

The nearest protected landscape is the Chilterns National Landscape, 1.6 mi north-west of the town’s edge. It covers 838 km² and was designated in 1990.

What are the best walks near Twyford?

3 waymarked walking routes pass within 2 km of the town, including the The Wokingham Way, European walking route E2 west, UK, South East England and Thames Path.

What is the nearest beach to Twyford?

Amity Beach, 15 mi from the edge of the town, then Penguin Beach (20 mi). Twyford itself is inland.

How many people in Twyford live near a park?

86% of residents live within 400 m, about a 5-minute walk, of a public park, garden or playing field (Census 2021 output areas against OS Open Greenspace). The typical UK town is 83%.

When is the best time of year for walking in Twyford?

May to September: the longest days, the warmest afternoons and the least rain of the year, from the Met Office 1991–2020 averages.

Is Twyford good for walking?

Paths are thinner than most towns: 2.1 km of footpath and right of way per square kilometre, more than 33% of UK towns. For park space per person it beats 56% (2.4 ha per 1,000 residents).

How is the Outdoors Grade worked out?

From five measures, each placed among UK towns of 1,000 or more: public green space per resident, the share living near a park, National Park or National Landscape within 5 km, footpaths per square kilometre, and the sea within 5 km. It is a character grade and isn’t part of Twyford’s overall grade.

Sources

Where Twyford’s outdoors figures come from

  • Parks and green space: Ordnance Survey OS Open Greenspace (parks and gardens, playing fields, play spaces, and their access points). Contains OS data © Crown copyright and database right 2026, Open Government Licence v3.0.
  • National Parks and National Landscapes: Natural England and Natural Resources Wales boundaries, areas and designation dates, Open Government Licence v3.0.
  • Footpaths, walking routes, beaches and things to do: © OpenStreetMap contributors, Open Database License (ODbL), via Geofabrik, 16 October 2026.
  • Historic parks, listed buildings and monuments: Historic England, National Heritage List for England, Open Government Licence v3.0.
  • Rain and temperature: Met Office HadUK-Grid 1991–2020 averages for the town; daylight calculated from its latitude.
  • The sea: ONS Countries (December 2024) boundaries clipped to mean high water. Residents near a park: ONS Census 2021 output areas.
  • Grade: TownRatings’ Outdoors Grade, ranked against UK towns only.

Contains public sector information licensed under the Open Government Licence v3.0. Contains HM Land Registry data © Crown copyright and database right 2026. Contains OS data © Crown copyright and database right 2026 (ONS boundaries). Northern Ireland: Source: NISRA; contains Land & Property Services data and Ordnance Survey of Northern Ireland information, © Crown copyright, licensed under the Open Government Licence v3.0. Scotland: contains National Records of Scotland data, Registers of Scotland data and SEPA data, © Crown copyright / © SEPA 2025, licensed under the Open Government Licence v3.0.