
Independence TownshipPA
A town of 2,236.
Is Independence Township a good place to live?
The best of Independence Township’s subject grades are a B+ for incomes and schools; the weakest is a D for walkability. The typical home is worth about $311K, 4.1 years of the Pittsburgh metro’s $76K median household income. Independence Township’s median age is 48.4 years, where Pennsylvania’s towns sit at 43.2 years and U.S. towns at 40.5 years. On history, just 33 of Pennsylvania’s 1,749 towns do worse. The biggest park or preserve is State Game Lands Number 189, at 349 acres. Independence Township has fewer than 2,500 residents, so it gets subject grades but no overall grade.
Independence Township has shrunk 11% since 2010
2,503 counted in 2010 and 2,248 in 2020; an estimated 2,236 in 2025.
U.S. Census 2010 & 2020 counts · Census Bureau estimate, July 1, 2025
How Independence Township grades
Each subject compared with towns across the country (schools within Pennsylvania), ordered by how far Independence Township is from typical.
How TownRatings grades towns →
Acrisure Stadium and 59 more within 40 miles
Museums, parks, gardens and other places to visit around Independence Township. Close and well known come first.
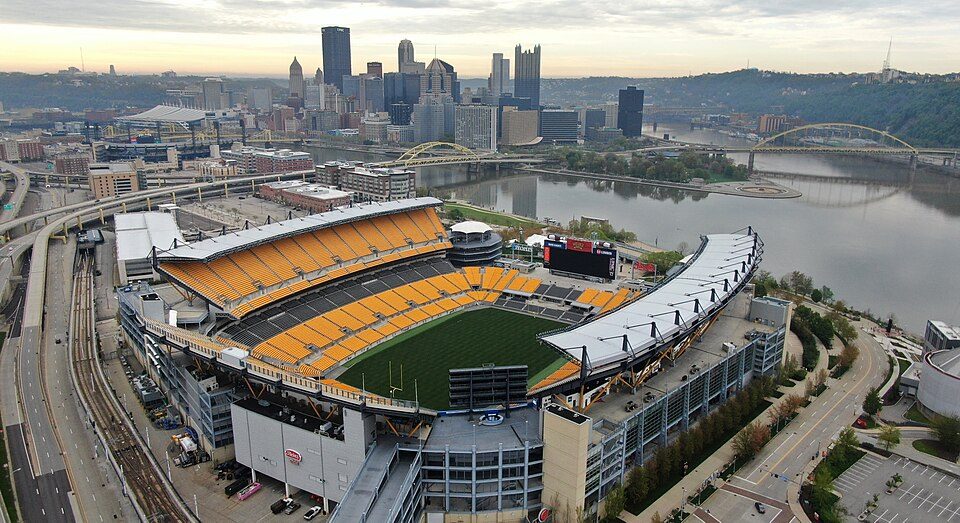 Big draw18 mi Stadium & arenaAcrisure Stadium
 18 mi LandmarkFort Duquesne
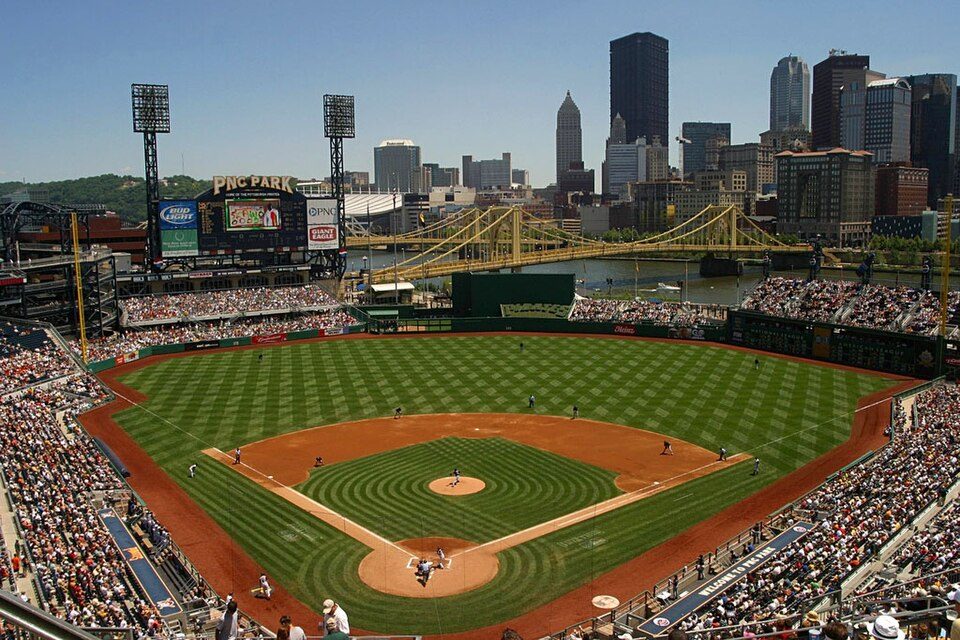 18 mi Stadium & arenaPNC Park
 27 mi Theme parkKennywood
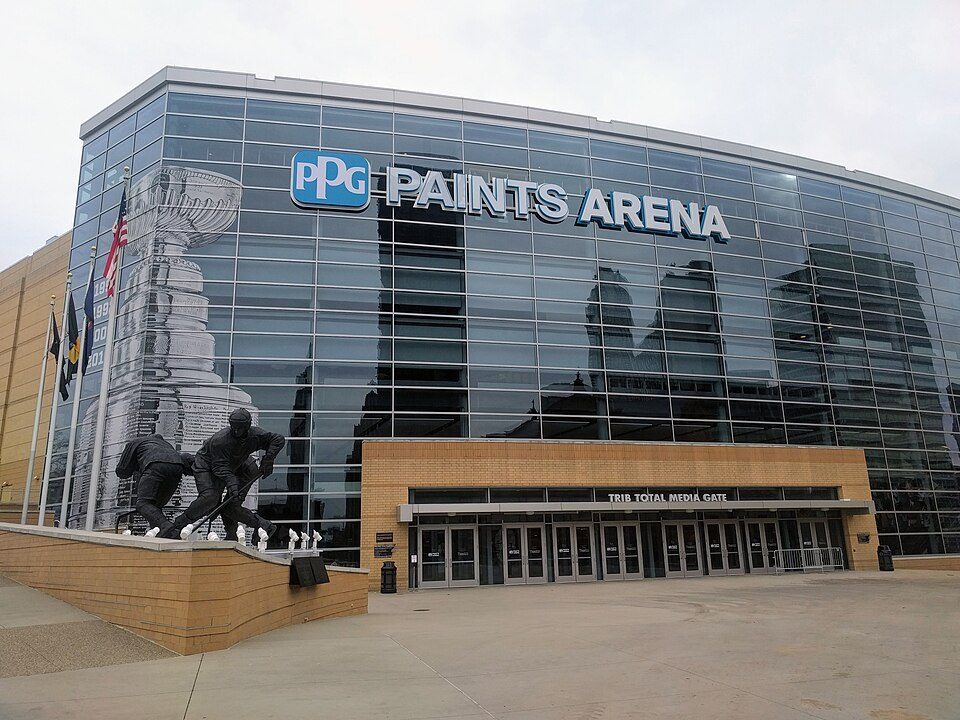 19 mi Stadium & arenaPPG Paints Arena
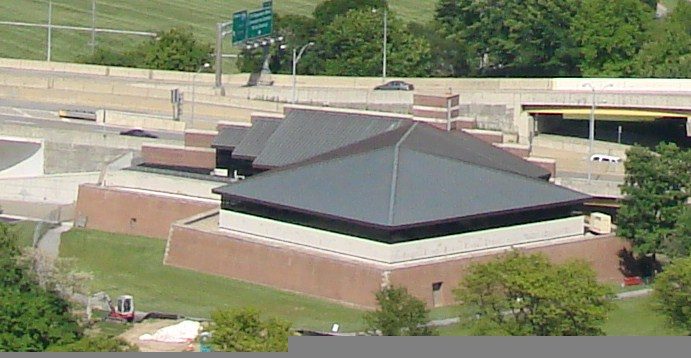 18 mi LandmarkFort Pitt
Photo credits
Acrisure Stadium: Fo2grfr, CC BY-SA 4.0 · Fort Duquesne: Sébastien Paquin, CC BY-SA 3.0 · PNC Park: alpineinc, CC BY 2.0 · Kennywood: Ski2007 of English Wikipedia, Public domain · PPG Paints Arena: Jleedev, CC BY-SA 4.0 · Fort Pitt: Downtown_Pittsburgh_May_2008.jpg: Allie Caufield derivative work: GrapedApe (tal, CC BY 2.0


Moving to Independence Township: who provides what
Who provides power, water and the rest in Independence Township, and how to reach them.
EPA SDWIS (Oct 9, 2026) · HIFLD + EIA-861 2025 · Census 2020 ZCTAs · NCES 2024–25 · registration: vote.gov, updated Nov 18, 2024.
The data
Ordered by what stands out in Independence Township.
With 0.2 jobs for every working resident, most of Independence Township’s workers commute out
Most working residents leave Independence Township for work: only 3% work in town. 13% of residents live below the poverty line in Independence Township, above both Pennsylvania’s towns (7.6%) and U.S. towns (9.6%). Independence Township’s average trip to work is 27 minutes.
| Independence Township | Pennsylvania towns | U.S. towns | |
|---|---|---|---|
| Below the poverty line | 13% | 7.6% | 9.6% |
| Working residents who work in town | 2.6% | 6.3% | 8% |
| Average trip to work | 27 minutes | 26 minutes | 25 minutes |
| Median household income | $93,000 | $81,000 | $80,000 |
Where working residents work
Census LEHD 2023 · ACS
Independence Township’s schools rank ahead of 68% of Pennsylvania districts
Its public schools are run by Hopewell Area SD. Its one school is below.
| School | Level | Students | Letter |
|---|---|---|---|
| Independence El SchLargest public elementary schoolGrades K–4 | Grades K–4 | 228 | B+ |
NCES · EDFacts · graded within PA on state tests and graduation
In Independence Township, expect snowy winters and pleasant summers
Independence Township has chilly, snowy winters and pleasant summers. July afternoons reach 84°, January nights drop to 21° and about 44 inches of snow falls in a winter.
Typical low → high °F
NOAA U.S. Climate Normals, 1991–2020
Crime reported in Independence Township
Independence Township's reported crime rate is well below Pennsylvania's. The property crime rate in Independence Township is 1.4 per 1,000 residents. Most reported incidents are property crimes, mainly thefts.
| Independence Township | Pennsylvania towns | U.S. towns | |
|---|---|---|---|
| Property crimes per 1,000 (2025) | 1.4 per 1,000 residents | 5.7 | 9.9 |
| Violent crimes per 1,000 (2025) | 0.5 per 1,000 residents | 0.7 | 1.6 |
Violent crime per 1,000 residents
Property crime per 1,000 residents
FBI crime data, 2025 · crimes reported to police
Independence Township has set aside 6.9% of its land for conservation
7.0 miles of trail in 2 parks and preserves.
| Independence Township | Pennsylvania towns | U.S. towns | |
|---|---|---|---|
| Miles of trail per square mile | 0.3 miles per square mile | 0.4 | 0.4 |
| Conserved land | 6.9% | 8.2% | 4.3% |
| Biggest places to walk | Trails | Acres |
|---|---|---|
| 1. Raccoon Creek State Park | 5.1 mi | 270 |
| 2. State Game Lands Number 189 | — | 349 |
Trails & parks © OpenStreetMap contributors · Conserved land: USGS PAD-US
Independence Township is healthier than 56% of U.S. towns
Independence Township beats the Pennsylvania average on 1 of 26 CDC measures and trails it on 1. 20% of Independence Township adults binge drink.
| Independence Township | Pennsylvania towns | U.S. towns | |
|---|---|---|---|
| Binge drink (CDC PLACES) | 20% | 18% | 16% |
| Obesity (CDC PLACES) | 38% | 35% | 35% |
| Smoke cigarettes (CDC PLACES) | 17% | 17% | 14% |
| Frequent mental distress (CDC PLACES) | 16% | 16% | 17% |
| What stands out | Independence Township | PA |
|---|---|---|
| Fewer older adults who have lost all their teeth | 11.3% | 14.5% |
| More adults with arthritis | 33.9% | 30.4% |
CDC PLACES 2025 · modeled estimates for adults · CMS · HRSA
An age mix much like Pennsylvania’s
No broad age group is more than 4 points off the Pennsylvania average. 18% of residents are under 18 in Independence Township. 32% of adults 25 and older have a bachelor’s degree or more, vs 35% across Pennsylvania.
| Independence Township | Pennsylvania towns | U.S. towns | |
|---|---|---|---|
| Under 18 | 18% | 20% | 22% |
| Aged 65 or older | 22% | 21% | 18% |
| Bachelor’s degree or more, 25+ | 32% | 29% | 29% |
Ages · share of residents
Education · adults 25 and older
Women and men · all residents
51% women, 49% men
That’s an even split within the survey’s margin of ±4.8 points. Across Pennsylvania, 50.7% of residents are women.
| Independence Township | PA | U.S. | |
|---|---|---|---|
| Under 10 | 10.4% | 10.8% | 11.6% |
| 10 to 17 | 7.3% | 9.7% | 10.3% |
| 18 to 24 | 4.6% | 9% | 9.1% |
| 25 to 34 | 15.4% | 13% | 13.7% |
| 35 to 44 | 10.2% | 12.6% | 13.2% |
| 45 to 54 | 9.7% | 11.9% | 12.2% |
| 55 to 64 | 20.5% | 13.6% | 12.7% |
| 65 to 74 | 16.3% | 11.4% | 10.2% |
| 75 and older | 5.7% | 8.1% | 7% |
| No diploma | 2.1% | 7.9% | 10.4% |
| High school | 39.7% | 32.9% | 26% |
| Some college | 13.2% | 15.1% | 19.1% |
| Associate’s | 12.8% | 8.9% | 8.8% |
| Bachelor’s | 22.6% | 20.9% | 21.6% |
| Graduate | 9.6% | 14.3% | 14.1% |
U.S. Census Bureau · ACS 2020-2024 5-year estimates · in a town of 2,200, single groups can be off by several points
Independence Township faces a moderate natural-hazard risk, led by inland flooding
Expected storm and flood damage is lower than in 52% of U.S. communities. Since 1978, 16 flood insurance claims have been paid out in Independence Township.
FEMA flood insurance claims · FEMA National Risk Index · OpenFEMA
Everything we know about Independence Township
Colleges nearby
6 within 15 miles of the center of Independence Township
About 1 of every 100 Independence Township residents are enrolled in college, against 6 across Pennsylvania.
97% of working residents leave Independence Township for work
Where Independence Township’s working residents go each day. Line width shows the share.
Census LEHD 2023
Independence Township’s neighbors
3 towns share a border with Independence Township.
| Town | PA rank | Overall | Cost | Safety | Schools | Health |
|---|---|---|---|---|---|---|
| Independence Township | — | — | C− | — | B+ | B |
| Findlay Township | #3 | A+ | B | A | A+ | A− |
| Hanover Township | #503 | B+ | B+ | — | A− | B− |
| Hopewell Township | #513 | B+ | B− | — | B+ | B− |
Independence Township has fewer than 2,500 residents, so it gets subject grades but no overall grade. Independence Township, Hanover Township and Hopewell Township report no FBI crime data of their own. Compare Independence Township with a neighbor →
Questions about Independence Township
Short answers, built from the data on this page.
Is Independence Township, PA expensive?
Yes. Cost of living, which also weighs rents, property taxes and how many households pay 30% or more of their income for housing, grades C−.