132 years in pictures
Census counts: 873 in 1900, a peak of 3,470 in 1960, 2,076 in 2020. The archive holds 2 old photos and papers going back to 2007 and 4 maps from 1904 on.
- 1894East McKeesport is settled
Each edition grades its towns against each other only.

East McKeesport’s best subject grades are an A+ for walkability and an A for cost of living; its weakest is a C− for schools. 11% of residents are under 18 in East McKeesport, against 20% in Pennsylvania’s towns and 22% across U.S. towns. On walkability, just 96 of Pennsylvania’s 1,749 towns do better. East McKeesport’s density of trails is 1.0 miles per square mile, above both Pennsylvania’s towns (0.4) and U.S. towns (0.4). East McKeesport has fewer than 2,500 residents, so it gets subject grades but no overall grade.
Where East McKeesport beats most towns.
Where East McKeesport’s working residents go each day. Line width shows the share.
Census LEHD 2023
Each subject compared with towns across the country (schools within Pennsylvania), ordered by how far East McKeesport is from typical.
How TownRatings grades towns →
Census counts: 873 in 1900, a peak of 3,470 in 1960, 2,076 in 2020. The archive holds 2 old photos and papers going back to 2007 and 4 maps from 1904 on.
Museums, parks, gardens and other places to visit around East McKeesport. Close and well known come first.
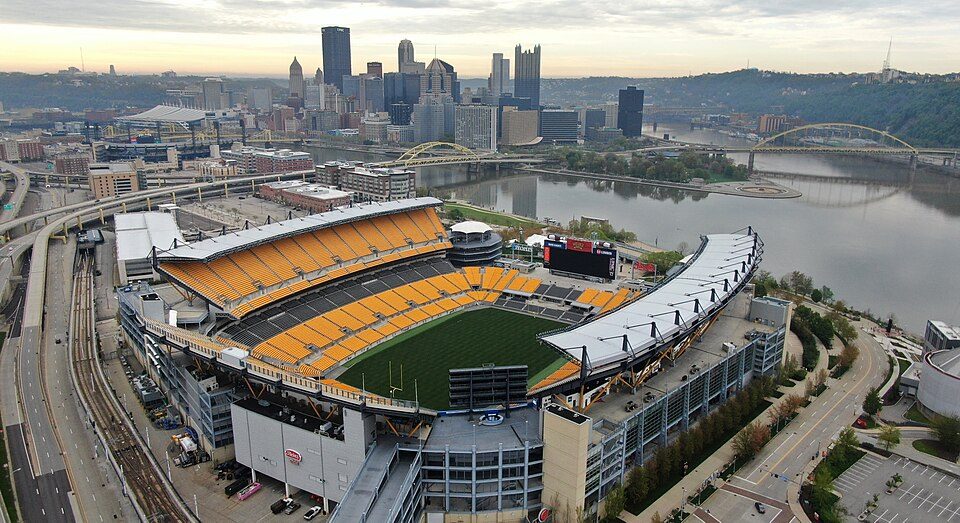
Big draw12 mi Stadium & arenaAcrisure Stadium
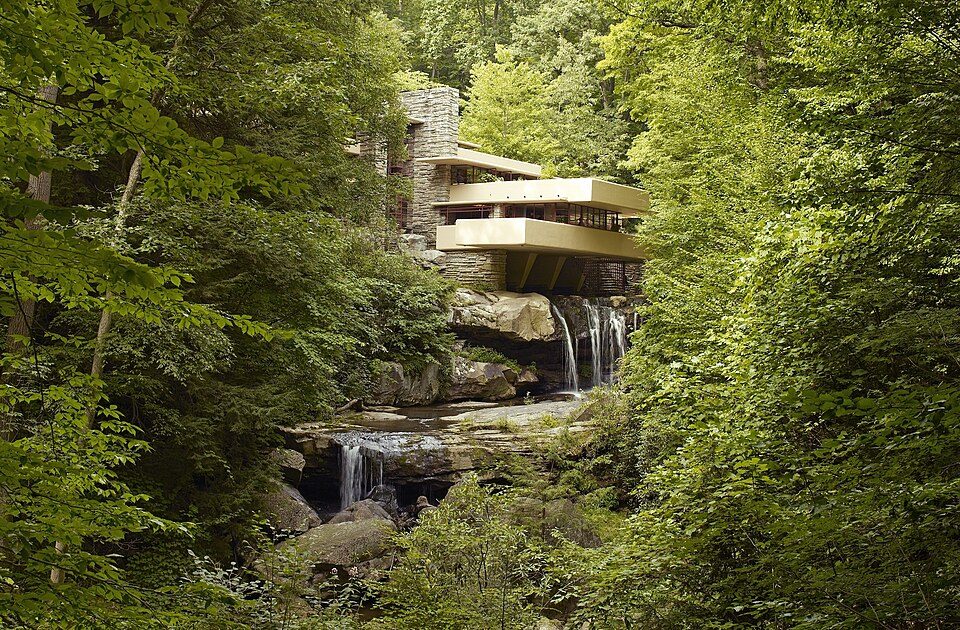
Big draw38 mi MuseumFallingwater
3 mi Theme parkKennywood
11 mi LandmarkFort Duquesne
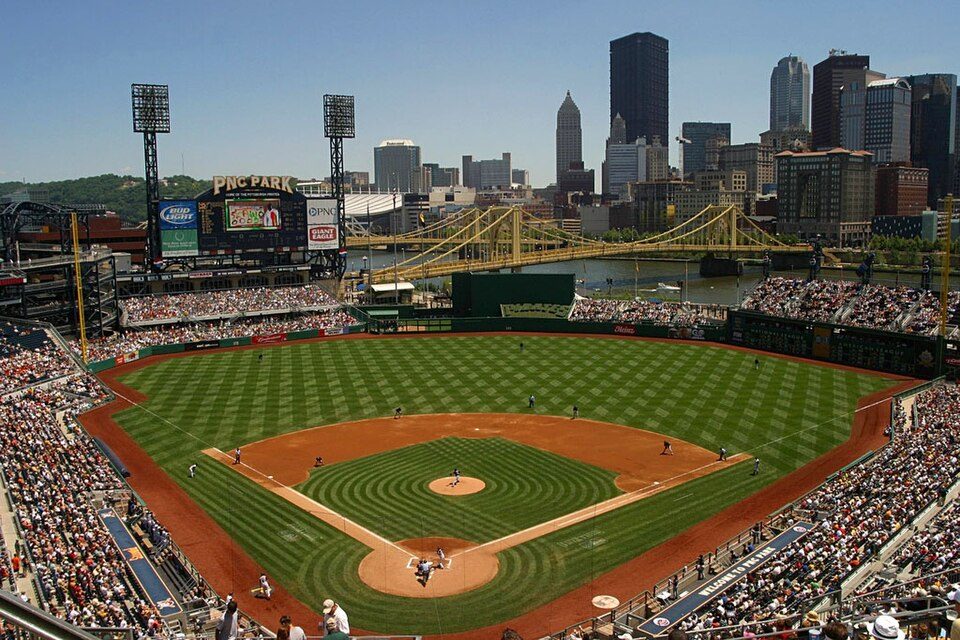
11 mi Stadium & arenaPNC Park
10 mi Stadium & arenaPPG Paints ArenaAcrisure Stadium: Fo2grfr, CC BY-SA 4.0 · Fallingwater: Carol M. Highsmith, Public domain · Kennywood: Ski2007 of English Wikipedia, Public domain · Fort Duquesne: Sébastien Paquin, CC BY-SA 3.0 · PNC Park: alpineinc, CC BY 2.0 · PPG Paints Arena: Jleedev, CC BY-SA 4.0
Who provides power, water and the rest in East McKeesport, and how to reach them.
EPA SDWIS (Oct 9, 2026) · HIFLD + EIA-861 2025 · Census 2020 ZCTAs · NCES 2024–25 · registration: vote.gov, updated Nov 18, 2024.
Ordered by what stands out in East McKeesport.
For East McKeesport, the going rate for rent is $780 a month. Typical home values fell 7.2% in the year to September 2026. Among households locally, 66% are owner-occupiers.
| East McKeesport | Pennsylvania towns | U.S. towns | |
|---|---|---|---|
| Median rent | $780 a month | $1,115 a month | $1,185 a month |
| Households that own their home | 66% | 78% | 73% |
Census ACS, 2020–24 · Zillow Home Value Index · Redfin Data Center
The top destinations are Pittsburgh (25%), Monroeville (8%) and North Versailles Township (5%). Most working residents leave East McKeesport for work: only 2% work in town. The town’s middle household income is $66,000. Half of commuters travel less than 9 miles.
| East McKeesport | Pennsylvania towns | U.S. towns | |
|---|---|---|---|
| Working residents who work in town | 1.9% | 6.3% | 8% |
| Median household income | $66,000 | $81,000 | $80,000 |
| Average trip to work | 24 minutes | 26 minutes | 25 minutes |
Census LEHD 2023 · ACS
FEMA puts 74% of East McKeesport’s expected hazard losses down to inland flooding, and 16% to cold waves. The risk rating from FEMA for East McKeesport comes to 26 of 100.
FEMA National Risk Index · OpenFEMA
A winter brings about 25 inches of snow, with January nights at 22° and July afternoons at 84°.
NOAA U.S. Climate Normals, 1991–2020
5 violent crimes were reported in 2025. The level of property crime in East McKeesport is 13.8 per 1,000 residents. East McKeesport's reported crime rate is close to Pennsylvania's. Most reported incidents are property crimes, mainly thefts.
| East McKeesport | Pennsylvania towns | U.S. towns | |
|---|---|---|---|
| Property crimes per 1,000 (2025) | 13.8 per 1,000 residents | 5.7 | 9.9 |
| Violent crimes per 1,000 (2025) | 2 per 1,000 residents | 0.7 | 1.6 |
FBI crime data, 2025 · crimes reported to police
For adults in East McKeesport, the share who have obesity is 33%. In East McKeesport, nearly a fifth of adults binge drink.
| East McKeesport | Pennsylvania towns | U.S. towns | |
|---|---|---|---|
| Binge drink (CDC PLACES) | 19% | 18% | 16% |
| Frequent mental distress (CDC PLACES) | 16% | 16% | 17% |
| Obesity (CDC PLACES) | 33% | 35% | 35% |
| Smoke cigarettes (CDC PLACES) | 16% | 17% | 14% |
| What stands out | East McKeesport | PA |
|---|---|---|
| More adults with arthritis | 33.9% | 30.4% |
CDC PLACES 2025 · modeled estimates for adults · CMS · HRSA
Parks and preserves in East McKeesport: one, of 1 acres.
| Biggest places to walk | Trails | Acres |
|---|---|---|
| 1. Chicora Street Park | — | 1 |
Trails & parks © OpenStreetMap contributors · Conserved land: USGS PAD-US
14 within 15 miles of the center of East McKeesport
About 3 of every 100 East McKeesport residents are enrolled in college, against 6 across Pennsylvania.
Borough in Pennsylvania, US
East McKeesport is a borough in Allegheny County, Pennsylvania, United States, and is part of the Pittsburgh metropolitan area. The population was 2,076 at the 2020 census.
From Wikipedia, licensed CC BY-SA 4.0 · facts via Wikidata (CC0)
2 towns share a border with East McKeesport.
| Town | PA rank | Overall | Cost | Safety | Schools | Health |
|---|---|---|---|---|---|---|
| East McKeesport | — | — | A | — | C− | B |
| North Versailles Township | #791 | C+ | B+ | B− | C− | C− |
| Wilmerding | — | — | A | — | C− | D |
East McKeesport and Wilmerding have fewer than 2,500 residents, so they get subject grades but no overall grade. East McKeesport and Wilmerding report no FBI crime data of their own. Compare East McKeesport with a neighbor →
Short answers, built from the data on this page.
Not for the area. Cost of living, which also weighs rents, property taxes and how many households pay 30% or more of their income for housing, grades A.