Trenton Township in pictures
The archive holds 5 old photos and papers going back to 2011 and 4 maps from 1902 on.
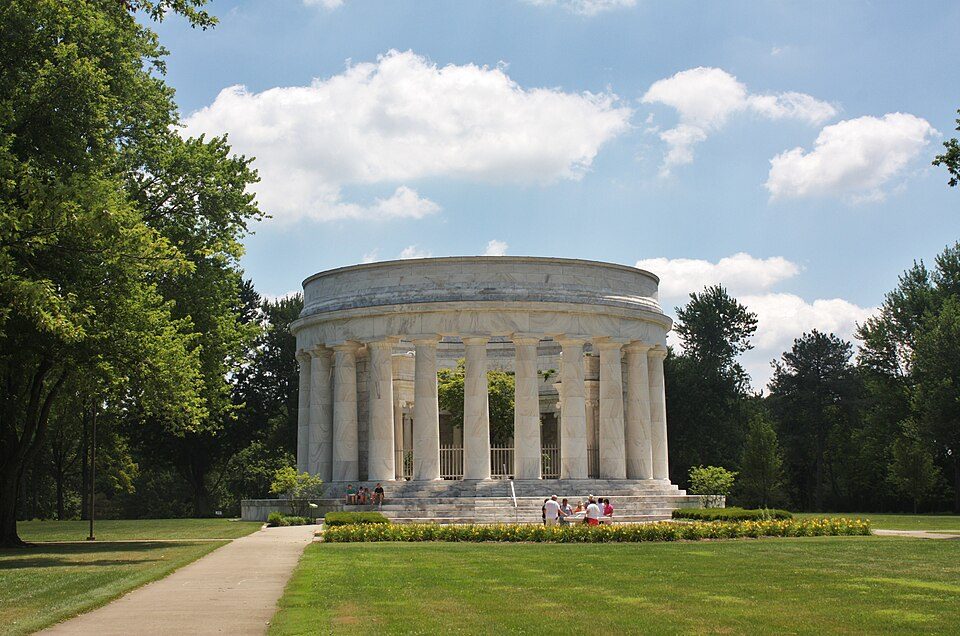
1 place on the National Register of Historic Places.
Explore the history →Each edition grades its towns against each other only.

Population 2,538: a town in Ohio.
Trenton Township does the important things well, at a cost. Its strongest subject is incomes: the median household earns $137K. At about $415K, a typical home costs 5.1 years of the Columbus metro’s $82K median household income. What holds it back is walkability. Most errands need a car: it is less walkable than 83% of U.S. towns. All told, that adds up to an A− overall and a rank of 269th of 987 in Ohio. Set against the rest, it does better than 76% of U.S. towns. Center Inn is on the National Register of Historic Places.
Figures: incomes, Census ACS, 2020–24 · home values, Zillow · National Register of Historic Places.
Where Trenton Township beats most towns.
| Widest gap | Trenton Township | OH |
|---|---|---|
| Fewer adults facing food insecurity | 7.9% | 14.1% |
Center InnWhere Trenton Township’s working residents go each day. Line width shows the share.
Census LEHD 2023
Each subject compared with towns across the country (schools within Ohio), ordered by how far Trenton Township is from typical.
How TownRatings grades towns →
The archive holds 5 old photos and papers going back to 2011 and 4 maps from 1902 on.
1 place on the National Register of Historic Places.
Explore the history →Museums, parks, gardens and other places to visit around Trenton Township. Close and well known come first.
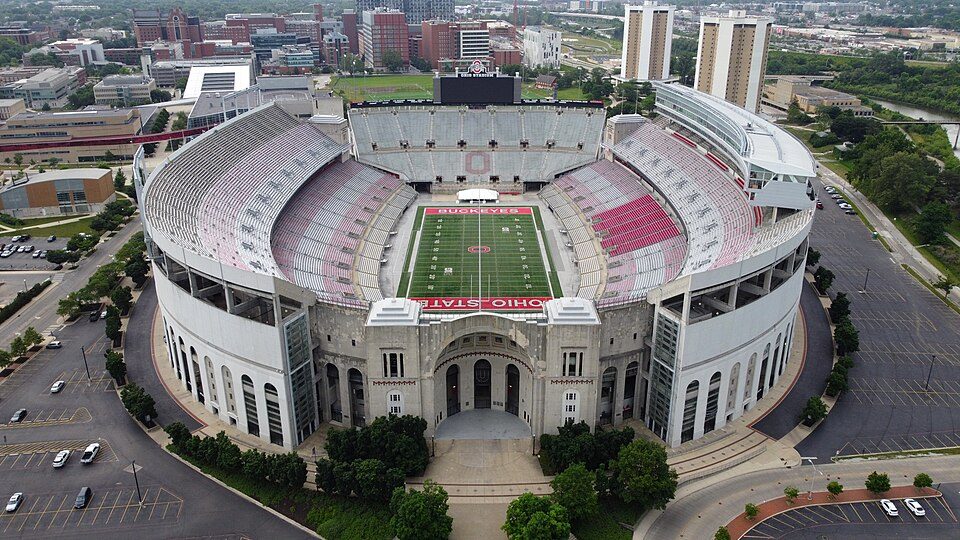
Big draw20 mi Stadium & arenaOhio Stadium
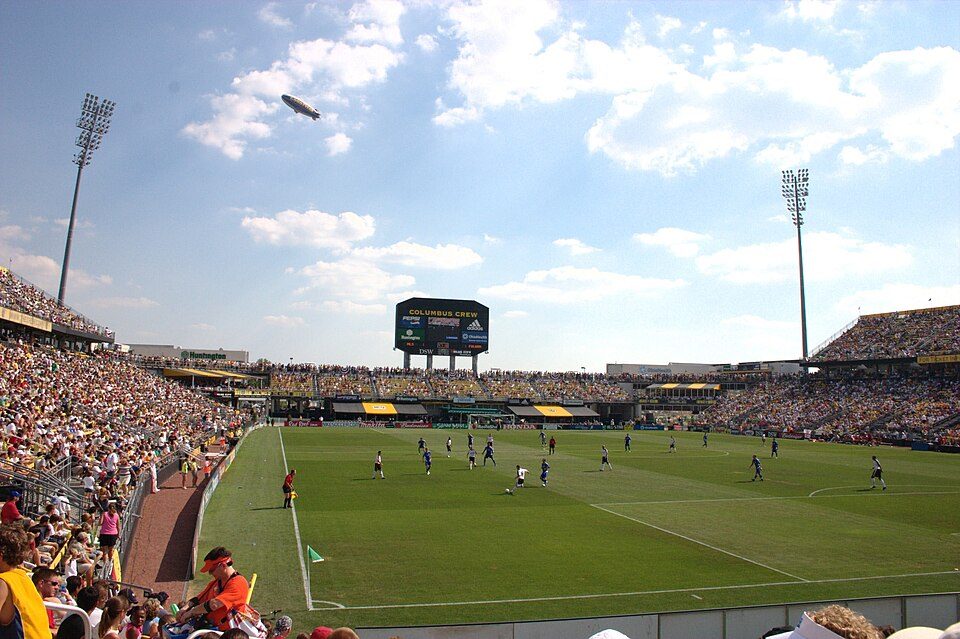
19 mi Stadium & arenaHistoric Crew Stadium
22 mi Stadium & arenaScottsMiracle-Gro Field
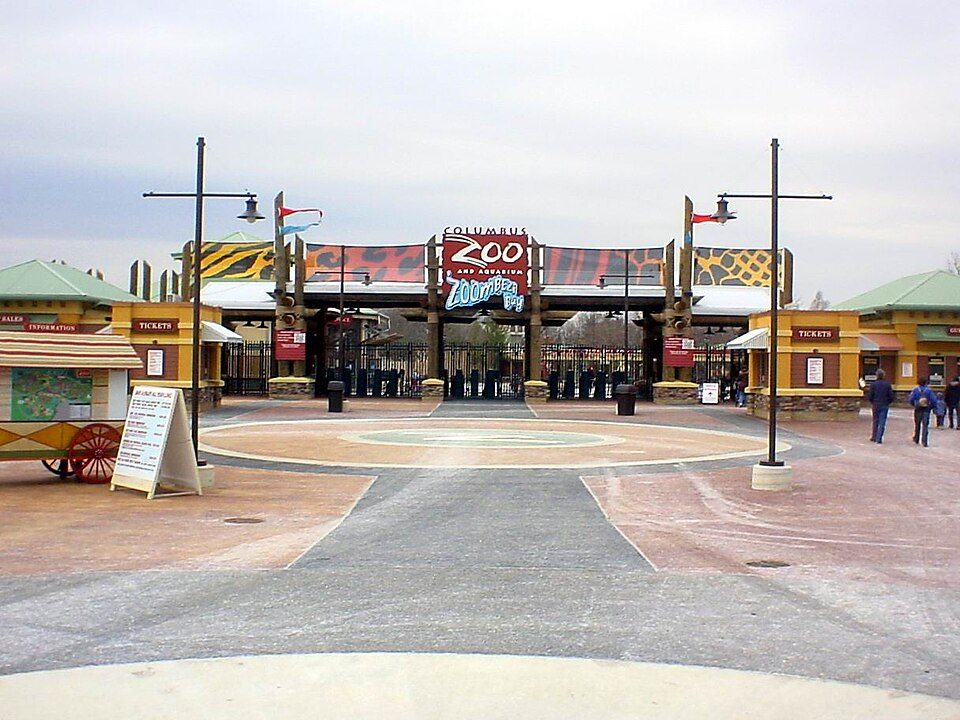
18 mi Zoo & aquariumColumbus Zoo and Aquarium
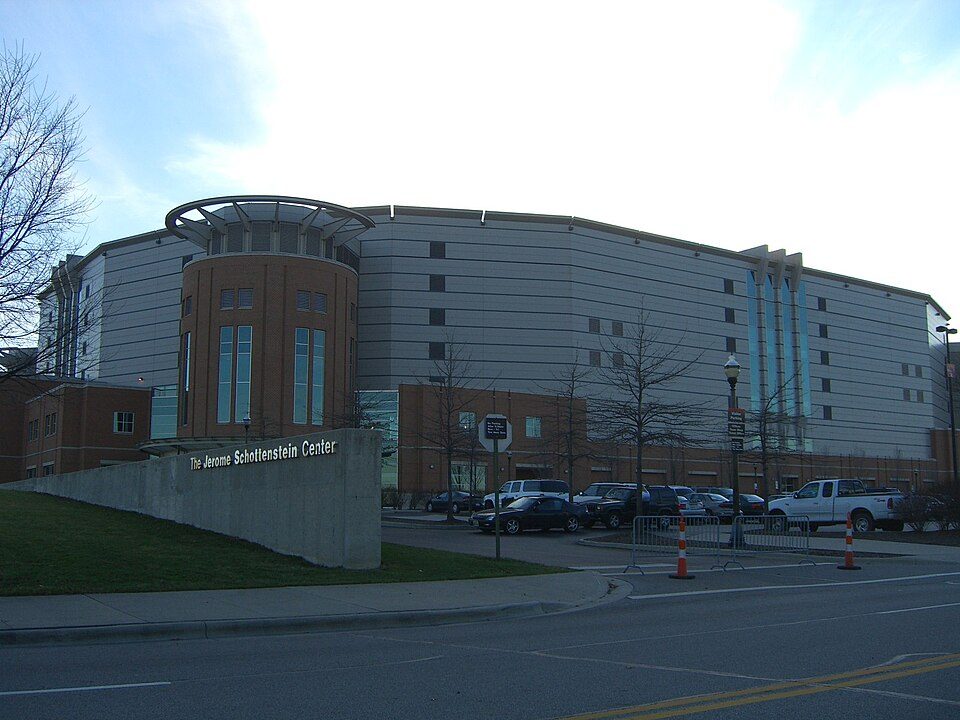
20 mi Stadium & arenaValue City Arena
29 mi LandmarkHarding TombOhio Stadium: Lectrician2, CC BY-SA 4.0 · Historic Crew Stadium: Rick Dikeman, CC BY-SA 3.0 · ScottsMiracle-Gro Field: Nova Crystallis, CC BY-SA 4.0 · Columbus Zoo and Aquarium: Adolphus79 at English Wikipedia, Public domain · Value City Arena: Nick81aku at English Wikipedia, Public domain · Harding Tomb: User:Postdlf, CC BY-SA 3.0
Who provides power, water and the rest in Trenton Township, and how to reach them.
EPA SDWIS (Oct 9, 2026) · HIFLD + EIA-861 2025 · Census 2020 ZCTAs · NCES 2024–25 · registration: vote.gov, updated Aug 3, 2026.
Ordered by what stands out in Trenton Township.
Trenton Township has less food insecurity than most of Ohio and has household incomes well above the Ohio norm, but it carries more natural-hazard risk than most of Ohio (mostly inland flooding).
Its widest gap with Ohio is food insecurity: 7.9% of its 11,137 adults worry about having enough food, against 14.1% statewide. Against the 3,873 U.S. towns with household incomes like Trenton Township’s, it is healthier than 52%, a smaller edge than it has nationally: part of it comes with its incomes.
Trenton Township: nearly a fifth of adults binge drink, above both Ohio’s towns (17%) and U.S. towns (16%). Just over a tenth of Trenton Township adults report frequent physical distress. In Trenton Township, 32% of adults sleep under 7 hours, and 19% get no exercise outside work.
| Trenton Township | Ohio towns | U.S. towns | |
|---|---|---|---|
| Frequent physical distress (CDC PLACES) | 11% | 15% | 14% |
| Sleep under 7 hours (CDC PLACES) | 32% | 38% | 36% |
| Get no exercise (CDC PLACES) | 19% | 28% | 25% |
| Binge drink (CDC PLACES) | 19% | 17% | 16% |
| What stands out | Trenton Township | OH |
|---|---|---|
| Fewer adults facing food insecurity | 7.9% | 14.1% |
| Fewer older adults who have lost all their teeth | 9.2% | 15.3% |
CDC PLACES 2025 · modeled estimates for adults · CMS · HRSA
Employers in Trenton Township shed 43 jobs between 2013 and 2023, to 402. The town’s typical journey to work stands at 27 minutes, where Ohio’s towns sit at 24 minutes and U.S. towns at 25 minutes. For most workers, Trenton Township is a place to come home to: only 2% work in town. The top destinations are Columbus (32%), Westerville (7%) and Sunbury (7%).
| Trenton Township | Ohio towns | U.S. towns | |
|---|---|---|---|
| Median household income | $137,000 | $75,000 | $80,000 |
| Below the poverty line | 1.4% | 9.1% | 9.6% |
| Average trip to work | 27 minutes | 24 minutes | 25 minutes |
| Working residents who work in town | 1.9% | 6.9% | 8% |
Census LEHD 2023 · ACS
5.7 miles of trail. The density of trails in Trenton Township is 0.2 miles per square mile.
Trails & parks © OpenStreetMap contributors · Conserved land: USGS PAD-US
The median household earns $136,667, against $71,389 across Ohio, one input to its A+ for jobs and income.
Among adults 25 and older in Trenton Township, 37% hold a bachelor’s degree or more. Adults 35 to 64 are 47% of residents (38% statewide); adults 18 to 34 are 15% of residents (22% statewide). Its median age stands at 50.7 years. 2,538 people lived in Trenton Township by the Census Bureau’s 2025 estimate, 10% more than in 2020.
| Trenton Township | Ohio towns | U.S. towns | |
|---|---|---|---|
| Median age | 50.7 years | 41.7 years | 40.5 years |
| Under 18 | 16% | 22% | 22% |
| Bachelor’s degree or more, 25+ | 37% | 24% | 29% |
| Aged 65 or older | 22% | 20% | 18% |
47% women, 53% men
That’s an even split within the survey’s margin of ±3.9 points. Across Ohio, 50.7% of residents are women. Among residents 18 to 24, 84% are men (OH 51%).
| Trenton Township | OH | U.S. | |
|---|---|---|---|
| Under 10 | 6.6% | 11.7% | 11.6% |
| 10 to 17 | 9.7% | 10.3% | 10.3% |
| 18 to 24 | 10.3% | 8.9% | 9.1% |
| 25 to 34 | 4.5% | 13.2% | 13.7% |
| 35 to 44 | 11.8% | 12.5% | 13.2% |
| 45 to 54 | 19.8% | 12% | 12.2% |
| 55 to 64 | 15.6% | 13.2% | 12.7% |
| 65 to 74 | 14.3% | 10.9% | 10.2% |
| 75 and older | 7.5% | 7.3% | 7% |
| No diploma | 3.5% | 8.2% | 10.4% |
| High school | 26% | 32.1% | 26% |
| Some college | 24.5% | 19.3% | 19.1% |
| Associate’s | 9% | 9% | 8.8% |
| Bachelor’s | 24% | 19.3% | 21.6% |
| Graduate | 13.1% | 12.2% | 14.1% |
Census population estimates, 2025 · U.S. Census Bureau · ACS 2020-2024 5-year estimates · in a town of 2,500, single groups can be off by several points
In July, afternoons reach 84°; in January, nights fall to 20°, and about 19 inches of snow falls in a winter.
NOAA U.S. Climate Normals, 1991–2020
FEMA rates its natural-hazard risk higher than 89% of Ohio towns, with expected losses of about $775 per resident a year; that rating is what its C+ for hazard risk is built on.
Households in Trenton Township have drawn federal disaster aid in 4 declared disasters, most recently in 2008. The town’s FEMA risk score comes in at 58 of 100. Of the losses FEMA expects here, 78% come from inland flooding and 8% from tornadoes. It has had 2 paid flood insurance claims since 2002.
FEMA disaster declarations and aid · FEMA flood insurance claims · FEMA National Risk Index · OpenFEMA
8 within 15 miles of the center of Trenton Township
About 7 of every 100 Trenton Township residents are enrolled in college, about the same as Ohio.
Township in Ohio, US
Trenton Township is one of the eighteen townships of Delaware County, Ohio, United States. As of the 2020 Census the population was 2,276.
From Wikipedia, licensed CC BY-SA 4.0 · facts via Wikidata (CC0)
5 towns share a border with Trenton Township.
| Town | OH rank | Overall | Cost | Safety | Schools | Health |
|---|---|---|---|---|---|---|
| Trenton Township | #269 | A− | C | — | A− | A |
| Sunbury | #120 | A | C− | A− | A− | A |
| Porter Township | — | — | C+ | — | A− | B+ |
| Berkshire Township | #258 | A− | D | — | A− | A |
| Hartford Township | — | — | C+ | — | B− | B+ |
| Harlem Township | #347 | B+ | C− | — | A− | A |
Porter Township and Hartford Township have fewer than 2,500 residents, so they get subject grades but no overall grade. Trenton Township, Porter Township, Berkshire Township, Hartford Township and Harlem Township report no FBI crime data of their own. Compare Trenton Township with a neighbor →
Short answers, built from the data on this page.
By most measures, yes. Trenton Township grades A− overall, better than 76% of U.S. towns and #269 of 987 in Ohio. It grades A for health and A− for schools. Walkability is its weak spot, with a C−.
Cost of living, which also weighs rents, property taxes and how many households pay 30% or more of their income for housing, grades C.