
Ohio Central 4026, 2009
South Zanesville’s story
South Zanesville in pictures
Census counts: 853 in 1910, 1,894 in 2020. The archive holds 3 old photos and papers going back to 2004 and 5 maps from 1910 on.
Explore the history →Each edition grades its towns against each other only.

With 1,907 residents, it is a town in Ohio.
The best of South Zanesville’s subject grades are an A− for cost of living and safety; the weakest is a C− for health. South Zanesville’s middle household income is $39,000, below both Ohio’s towns ($75,000) and U.S. towns ($80,000). South Zanesville is easier to get around on foot or by transit than 69% of U.S. towns. South Zanesville has fewer than 2,500 residents, so it gets subject grades but no overall grade.
Where South Zanesville beats most towns.
Where South Zanesville’s working residents go each day. Line width shows the share.
Census LEHD 2023
Each subject compared with towns across the country (schools within Ohio), ordered by how far South Zanesville is from typical.
How TownRatings grades towns →
Census counts: 853 in 1910, 1,894 in 2020. The archive holds 3 old photos and papers going back to 2004 and 5 maps from 1910 on.
Explore the history →Who provides power, water and the rest in South Zanesville, and how to reach them.
EPA SDWIS (Oct 9, 2026) · HIFLD + EIA-861 2025 · Census 2020 ZCTAs · NCES 2024–25 · registration: vote.gov, updated Aug 3, 2026.
Ordered by what stands out in South Zanesville.
44% of adults in South Zanesville have obesity; 29% have been diagnosed with depression. The share of adults in South Zanesville who sleep under 7 hours: 43%.
| South Zanesville | Ohio towns | U.S. towns | |
|---|---|---|---|
| Sleep under 7 hours (CDC PLACES) | 43% | 38% | 36% |
| Obesity (CDC PLACES) | 44% | 38% | 35% |
| Depression (CDC PLACES) | 29% | 26% | 23% |
| Frequent mental distress (CDC PLACES) | 20% | 18% | 17% |
| What stands out | South Zanesville | OH |
|---|---|---|
| More older adults who have lost all their teeth | 21.3% | 15.3% |
| More smokers | 18.6% | 15.4% |
| More adults with COPD | 9.6% | 8% |
CDC PLACES 2025 · modeled estimates for adults · CMS · HRSA
South Zanesville’s level of violent crime stands at 0.5 per 1,000 residents. Its property crime rate stands at 4.2 per 1,000 residents.
| South Zanesville | Ohio towns | U.S. towns | |
|---|---|---|---|
| Property crimes per 1,000 (2025) | 4.2 per 1,000 residents | 9.4 | 9.9 |
| Violent crimes per 1,000 (2025) | 0.5 per 1,000 residents | 1.2 | 1.6 |
FBI crime data, 2025 · crimes reported to police
Home values are down 3.8% over the year to September 2026. The median rent in South Zanesville is $799 a month. 65% of South Zanesville households are owner-occupiers.
| South Zanesville | Ohio towns | U.S. towns | |
|---|---|---|---|
| Households that own their home | 65% | 77% | 73% |
| Median rent | $799 a month | $944 a month | $1,185 a month |
Census ACS, 2020–24 · Zillow Home Value Index · Redfin Data Center
Among working residents in South Zanesville, 3.2% work locally. Half of commuters travel less than 8 miles. For South Zanesville, the average commute is 23 minutes. The top destinations are Zanesville (29%), Columbus (8%) and Newton Township (4%).
| South Zanesville | Ohio towns | U.S. towns | |
|---|---|---|---|
| Below the poverty line | 16% | 9.1% | 9.6% |
| Working residents who work in town | 3.2% | 6.9% | 8% |
| Average trip to work | 23 minutes | 24 minutes | 25 minutes |
Census LEHD 2023 · ACS
The typical July afternoon high for South Zanesville comes to 85°F.
NOAA U.S. Climate Normals, 1991–2020
0.2 miles of trail wind through 1 park or preserve. South Zanesville has one park or preserve, 8 acres in all. In South Zanesville, the concentration of trails is 0.3 miles per square mile.
| South Zanesville | Ohio towns | U.S. towns | |
|---|---|---|---|
| Miles of trail per square mile | 0.3 miles per square mile | 0.2 | 0.4 |
| Conserved land | 4% | 3.7% | 4.3% |
| Biggest places to walk | Trails | Acres |
|---|---|---|
| 1. South Zanesville Village Park | — | 8 |
Trails & parks © OpenStreetMap contributors · Conserved land: USGS PAD-US
Nearly four fifths of South Zanesville’s expected losses from natural hazards come from inland flooding, followed by tornadoes at 6%. FEMA expects more storm and flood damage locally than in 54% of U.S. communities. Federal aid has come to South Zanesville households in 2 declared disasters; the latest was in 2012.
FEMA disaster declarations and aid · FEMA National Risk Index · OpenFEMA
Museums, parks, gardens and other places to visit around South Zanesville. Close and well known come first.
 16 mi Zoo & aquariumThe Wilds
 28 mi Ancient siteAlligator Effigy Mound
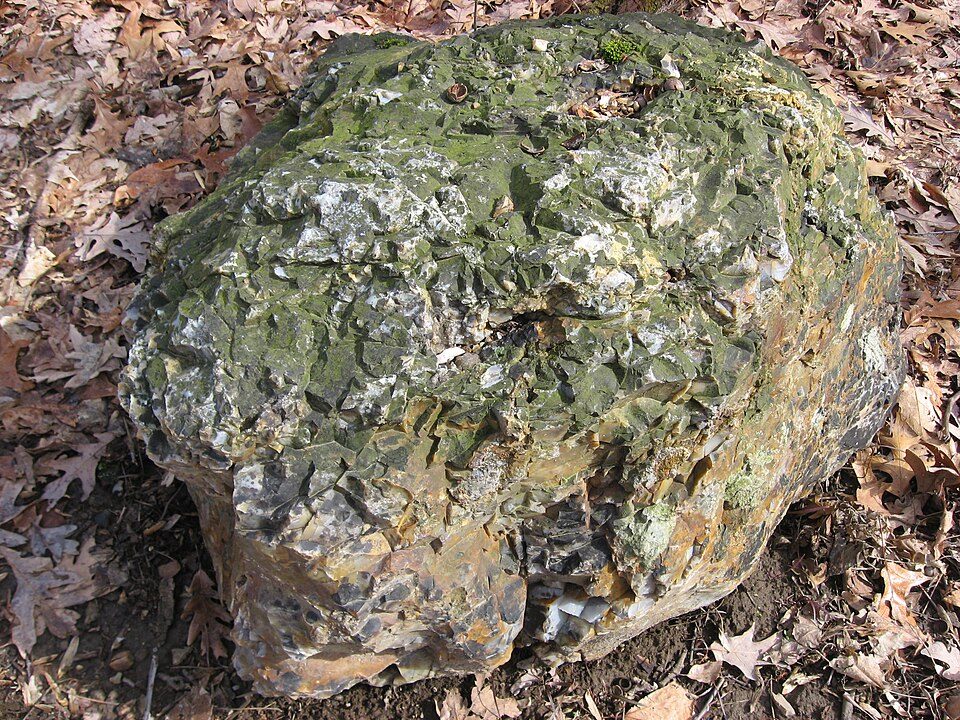 14 mi MuseumFlint Ridge State Memorial
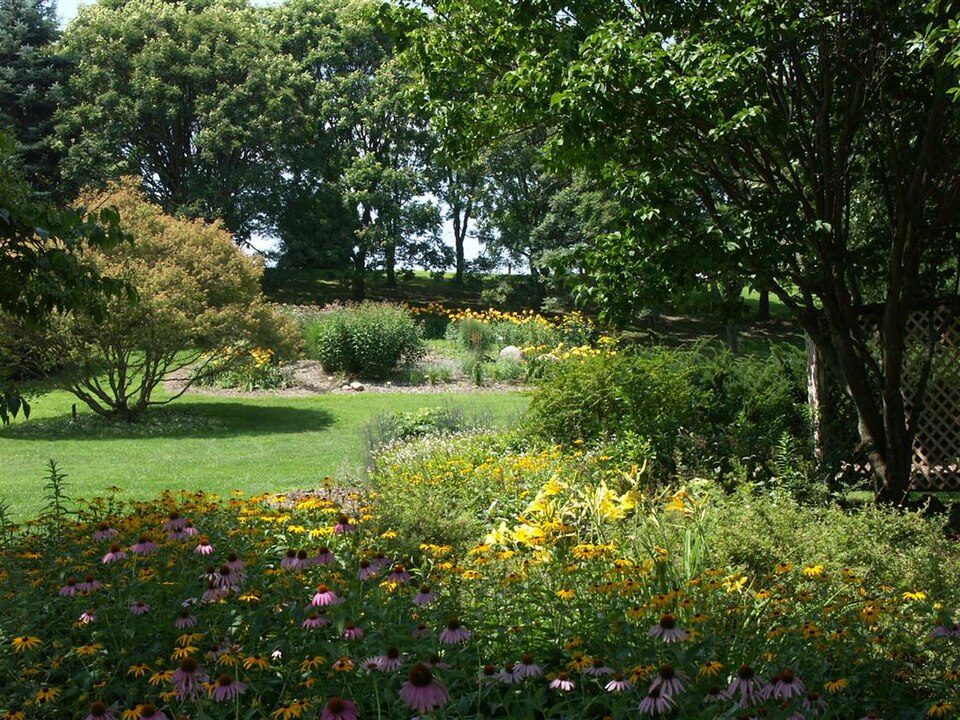 22 mi GardenDawes Arboretum
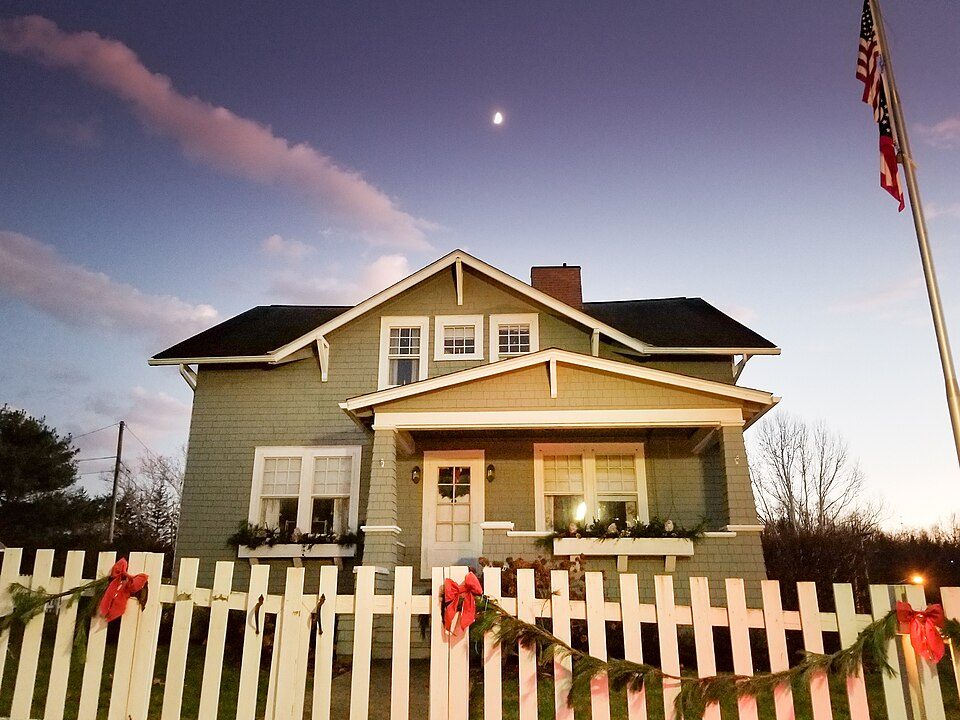 16 mi MuseumJohn and Annie Glenn Museum27 mi MuseumJohnson-Humrickhouse Museum
The Wilds: Bikingshaun (talk), CC BY 3.0 · Alligator Effigy Mound: Rev. Stephen D. Peet, editor, Public domain · Flint Ridge State Memorial: Nyttend, Public domain · Dawes Arboretum: Annmarie Creamer, Public domain · John and Annie Glenn Museum: Akflyer, CC BY-SA 4.0
2 within 15 miles of the center of South Zanesville
About 1 of every 100 South Zanesville residents are enrolled in college, against 6 across Ohio.
Village in Ohio, United States
South Zanesville is a village in Muskingum County, Ohio, United States, along the Muskingum River near the mouth of the Moxahala Creek. The population was 1,894 at the 2020 census. It is part of the Zanesville micropolitan area.
From Wikipedia, licensed CC BY-SA 4.0 · facts via Wikidata (CC0)
One town shares a border with South Zanesville.
| Town | OH rank | Overall | Cost | Safety | Schools | Health |
|---|---|---|---|---|---|---|
| South Zanesville | — | — | A− | A− | B− | C− |
| Zanesville | #970 | D | B+ | D | C+ | D− |
South Zanesville has fewer than 2,500 residents, so it gets subject grades but no overall grade. Compare South Zanesville with a neighbor →
Short answers, built from the data on this page.
Not for the area. Cost of living, which also weighs rents, property taxes and how many households pay 30% or more of their income for housing, grades A−.


