Dry RunOH
A town of 7,687 in Ohio.
Is Dry Run a good place to live?
Much to like here, and you pay for it. Incomes is its strong suit (A+): the median household earns $201K. Health is a strength too (A): it is healthier than 95% of U.S. towns. What counts against it is cost of living: the typical home is worth about $546K, 6.7 years of the Cincinnati metro’s $81K median household income. All told, that adds up to an A overall and a rank of 126th of 987 in Ohio. It comes out better than 88% of U.S. towns. On history, just 19 of Ohio’s 1,718 towns do worse. 74% of adults 25 and older hold a bachelor’s degree or more in Dry Run, where Ohio’s towns sit at 24% and U.S. towns at 29%.
Figures: incomes, Census ACS, 2020–24 · health, CDC PLACES · home values, Zillow · National Register of Historic Places.
What makes Dry Run stand out
Where Dry Run beats most towns.
99% of working residents leave Dry Run for work
Where Dry Run’s working residents go each day. Line width shows the share.
Census LEHD 2023
How Dry Run grades
Each subject compared with towns across the country (schools within Ohio), ordered by how far Dry Run is from typical.
How TownRatings grades towns →
Kings Island and 54 more within 40 miles
Museums, parks, gardens and other places to visit around Dry Run. Close and well known come first.
 Big draw17 mi Theme parkKings Island3.5M visitors a year
 10 mi Stadium & arenaPaycor Stadium
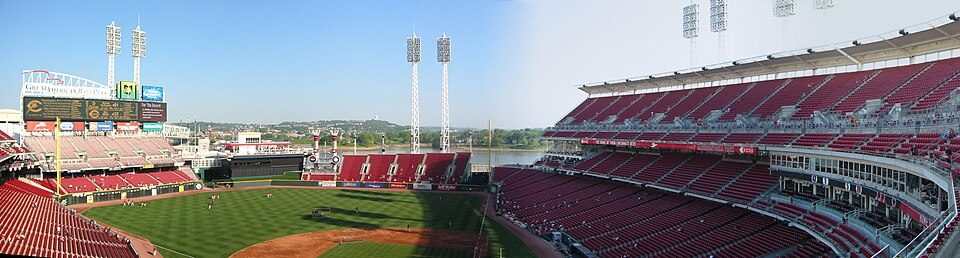 9 mi Stadium & arenaGreat American Ball Park
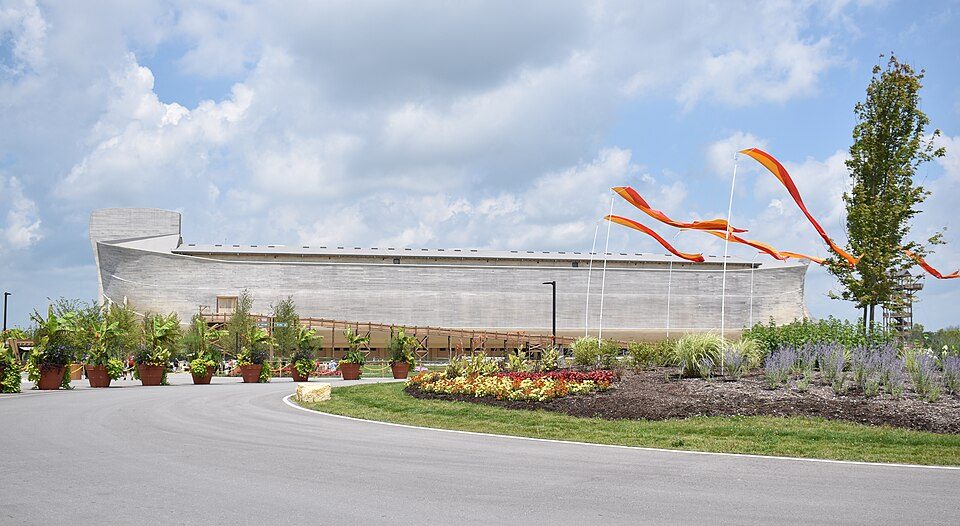 Big draw36 mi Theme parkArk Encounter
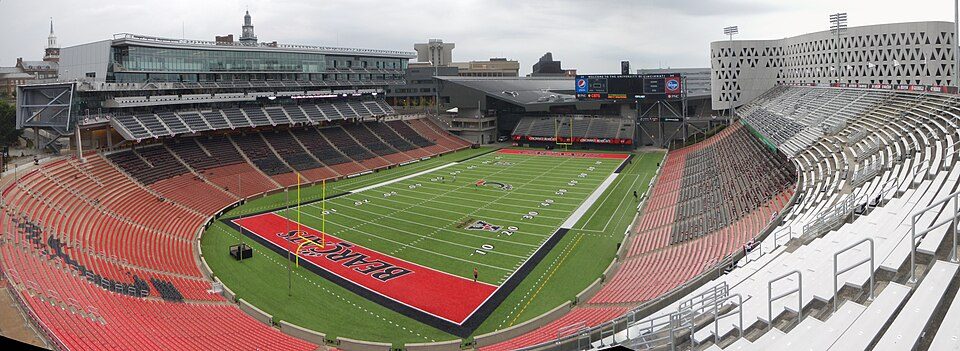 10 mi Stadium & arenaNippert Stadium
 10 mi Stadium & arenaTQL Stadium
Photo credits
Kings Island: Eli Duke from Portland, OR, USA, CC BY-SA 2.0 · Paycor Stadium: JonRidinger, CC BY-SA 4.0 · Great American Ball Park: Eric Kilby profile at Flickr website, CC BY-SA 2.0 · Ark Encounter: OlinEJ, CC0 · Nippert Stadium: Ben Levin, CC BY-SA 4.0 · TQL Stadium: Cornfield948, CC BY-SA 3.0


Moving to Dry Run: who provides what
Dry Run is unincorporated, so Hamilton County and regional agencies provide most services.
EPA SDWIS (Oct 9, 2026) · HIFLD + EIA-861 2025 · Census 2020 ZCTAs · NCES 2024–25 · registration: vote.gov, updated Aug 3, 2026.
The data
Ordered by what stands out in Dry Run.
Dry Run has less tooth loss than most of Ohio and sends most of its workers to Cincinnati and beyond, but it has homes that cost more against local pay than most of Ohio.
Dry Run stands out in Ohio and nationally: the median rent there is higher
At 6.7 years of the Cincinnati metro’s $81K median household income, the typical home (about $546K) costs more against local pay than in 97% of Ohio towns; that ratio is one input to its C− for cost of living. The median property tax bill is $8,623, against $2,822 across Ohio, another input to its cost-of-living grade.
Homes in Dry Run are typically worth about $546,000, up 3% in a year, more than twice the Ohio typical home. 97% of Dry Run households own their home. In Dry Run, 63% of sales closed above the list price.
| Dry Run | Ohio towns | U.S. towns | |
|---|---|---|---|
| Median rent | $2,300 a month | $943 a month | $1,185 a month |
| Households that own their home | 97% | 77% | 73% |
Typical home value
Census ACS, 2020–24 · Zillow Home Value Index · Redfin Data Center
A smaller share of adults report frequent physical distress in Dry Run than in most of Ohio or the rest of the country
Its widest gap with Ohio is tooth loss: 5.3% of those 65+ have lost all their teeth, against 15.3% statewide. Against the 1,053 U.S. towns with household incomes like Dry Run’s, it is less healthy than 63%: its national edge comes with its incomes.
Among adults in Dry Run, 25% have been diagnosed with depression. Only 9 of the 993 Ohio towns we compare have a lower share of adults who feel lonely than Dry Run. The town does better than the Ohio average on 25 of 32 CDC measures and worse on 1.
| Dry Run | Ohio towns | U.S. towns | |
|---|---|---|---|
| Frequent physical distress (CDC PLACES) | 9.6% | 15% | 14% |
| Get no exercise (CDC PLACES) | 16% | 28% | 25% |
| Feel lonely (CDC PLACES) | 29% | 34% | 33% |
| Smoke cigarettes (CDC PLACES) | 9.4% | 16% | 14% |
| What stands out | Dry Run | OH |
|---|---|---|
| Fewer older adults who have lost all their teeth | 5.3% | 15.3% |
| Fewer adults facing food insecurity | 5.9% | 14.1% |
| More binge drinkers | 19.3% | 16.6% |
CDC PLACES 2025 · modeled estimates for adults · CMS · HRSA
About one in three of Dry Run’s working residents commute to Cincinnati
Dry Run has 527 jobs for its 3,409 working residents: even if every job went to a resident, most would still commute out. Jobs based here grew from 379 in 2013 to 527.
For residents in Dry Run, the share who live below the poverty line is 1.4%. Only 1% of working residents stay in Dry Run for work; the rest commute out. Employers in Dry Run added 148 jobs between 2013 and 2023, to 527. Among 992 Ohio towns, just 4 have a higher typical household income than Dry Run.
| Dry Run | Ohio towns | U.S. towns | |
|---|---|---|---|
| Median household income | $201,000 | $75,000 | $80,000 |
| Work from home | 23% | 9.7% | 11% |
| Below the poverty line | 1.4% | 9.1% | 9.6% |
| Working residents who work in town | 1.2% | 6.9% | 8% |
Where working residents work
Census LEHD 2023 · ACS
Low risk in Dry Run, with inland flooding at the top
Flood insurance has paid out on 2 claims in Dry Run since 1978. On expected storm and flood damage, Dry Run sits below 72% of U.S. communities. 56% of the town’s expected losses from natural hazards come from inland flooding, followed by tornadoes at 21%.
FEMA flood insurance claims · FEMA National Risk Index · OpenFEMA
Four seasons and pleasant summers: that is Dry Run’s year
July afternoons reach 86°, January nights drop to 23° and about 16 inches of snow falls in a winter.
Typical low → high °F
NOAA U.S. Climate Normals, 1991–2020
Dry Run keeps 6% of its land conserved
The biggest park or preserve is Johnson Hills Park, at 95 acres. There are 0.5 miles of trail across 1 park or preserve. In Dry Run, the trail network density is 0.1 miles per square mile.
| Dry Run | Ohio towns | U.S. towns | |
|---|---|---|---|
| Miles of trail per square mile | 0.1 miles per square mile | 0.2 | 0.4 |
| Conserved land | 6% | 3.7% | 4.3% |
| Biggest places to walk | Trails | Acres |
|---|---|---|
| 1. Johnson Hills Park | 0.5 mi | 95 |
Trails & parks © OpenStreetMap contributors · Conserved land: USGS PAD-US
Everything we know about Dry Run
Colleges nearby
15 within 15 miles of the center of Dry Run
About 3 of every 100 Dry Run residents are enrolled in college, against 6 across Ohio.
About Dry Run
Census-designated place in Ohio, United States
Dry Run is a census-designated place (CDP) in Anderson Township, Hamilton County, Ohio, United States. The population was 7,672 at the 2020 census.
From Wikipedia, licensed CC BY-SA 4.0 · facts via Wikidata (CC0)
- Area
- 4.7 sq mi
- Elevation
- 873 ft
Dry Run’s neighbors
4 towns share a border with Dry Run.
| Town | OH rank | Overall | Cost | Safety | Schools | Health |
|---|---|---|---|---|---|---|
| Dry Run | #126 | A | C− | — | A | A |
| Newtown | #191 | A− | D | — | A | A |
| Turpin Hills | #106 | A | D | — | A | A |
| Forestville | #112 | A | D | — | A | A |
| Cherry Grove | #43 | A+ | C | — | A | A |
Dry Run, Newtown, Turpin Hills, Forestville and Cherry Grove report no FBI crime data of their own. Compare Dry Run with a neighbor →
Questions about Dry Run
Short answers, built from the data on this page.
Is Dry Run, OH a good place to live?
For most people who can afford it, yes. Dry Run grades A overall, better than 88% of U.S. towns and #126 of 987 in Ohio. It grades A for health and A for schools. Cost of living is its weak spot, with a C−.
Is Dry Run, OH expensive?
Yes. Cost of living, which also weighs rents, property taxes and how many households pay 30% or more of their income for housing, grades C−.