

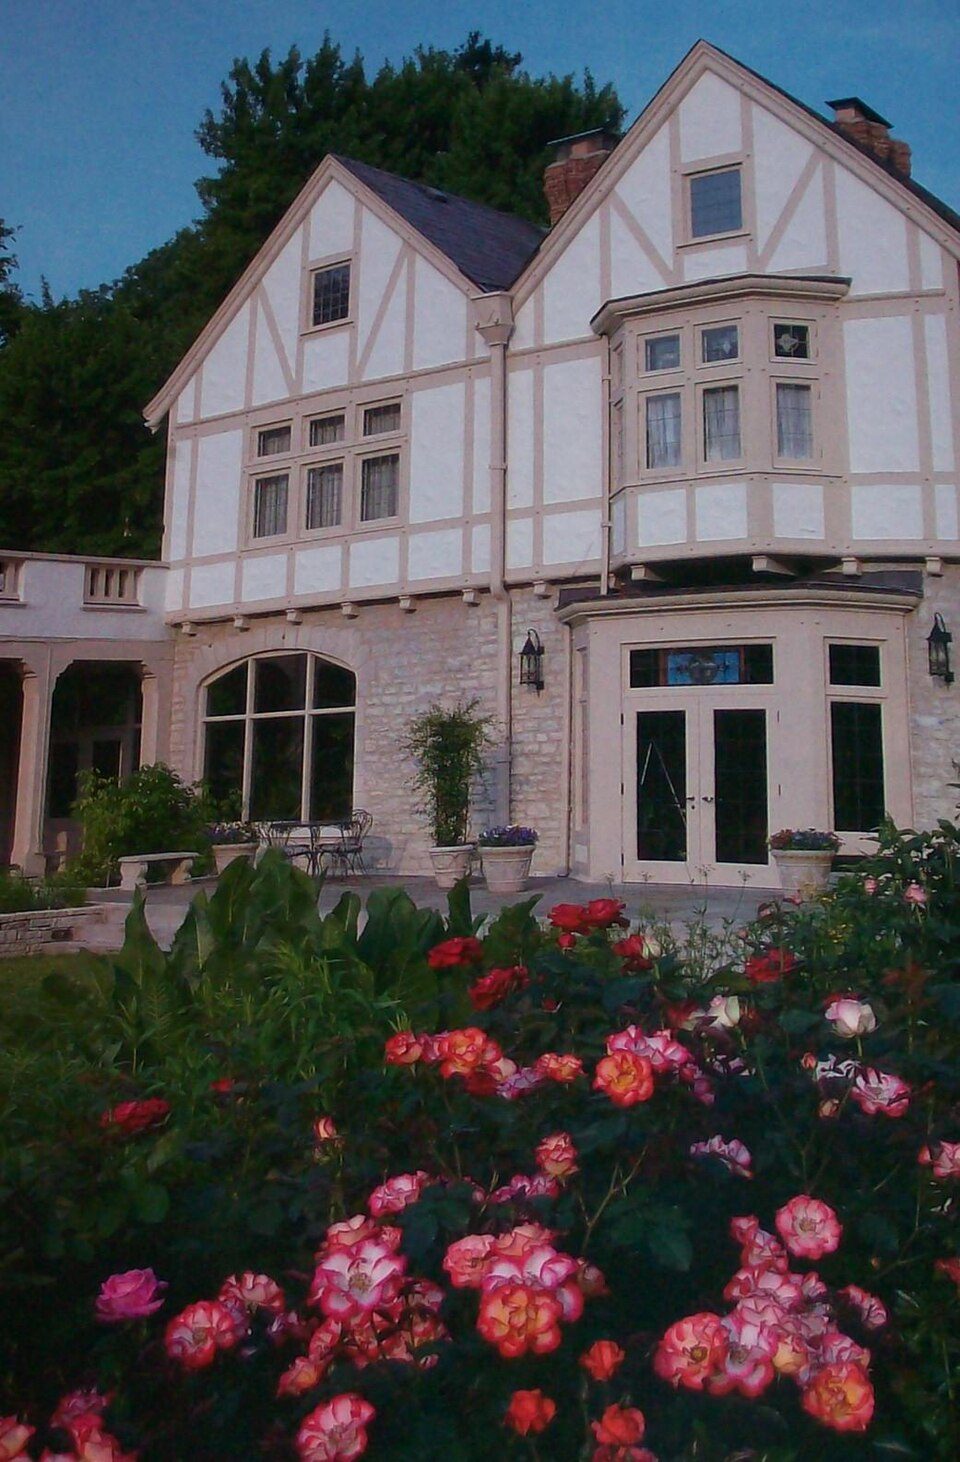
Charles S. Osborn House · National Register of Historic Places
Blendon Township’s story
201 years in pictures
The archive holds a map from 1902 on.
1 place on the National Register of Historic Places.
- 1825Blendon Township is settled
Each edition grades its towns against each other only.

Blendon Township's standout: it has 6 miles of trail. Overall it grades A−, 204th among Ohio's 987 graded towns. The median household earns $102K and CDC estimates put its residents' health ahead of 83% of the country. 14% of the land in Blendon Township is conserved, where Ohio’s towns sit at 3.7% and U.S. towns at 4.3%. Hoover Dam Park, at 670 acres with 1.5 miles of trail, is the biggest park or preserve. Blendon Township is more walkable than 68% of U.S. towns.
Where Blendon Township beats most towns.
13.6% of the town is conserved land, across 5 parks and preserves.
Each subject compared with towns across the country (schools within Ohio), ordered by how far Blendon Township is from typical.
How TownRatings grades towns →
The archive holds a map from 1902 on.
1 place on the National Register of Historic Places.
Museums, parks, gardens and other places to visit around Blendon Township. Close and well known come first.
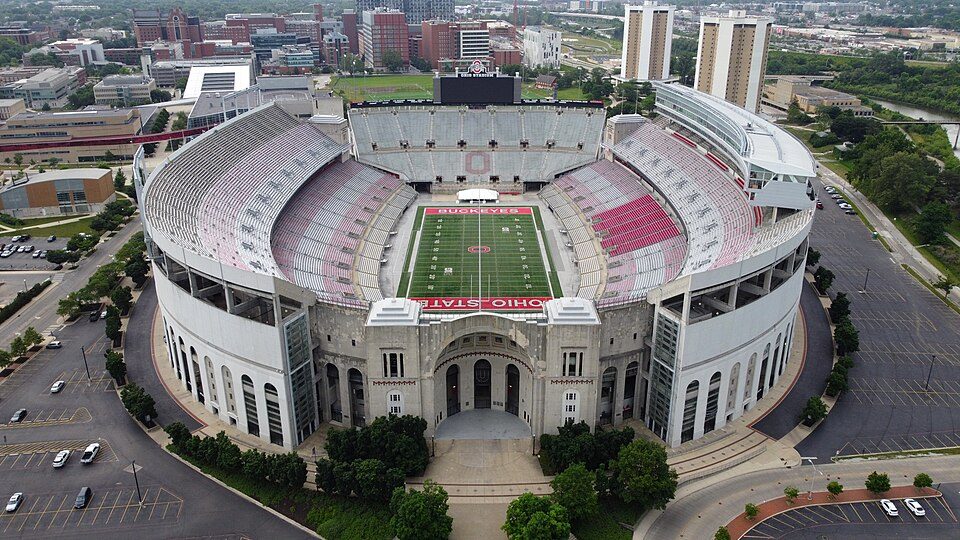 Big draw11 mi Stadium & arenaOhio Stadium
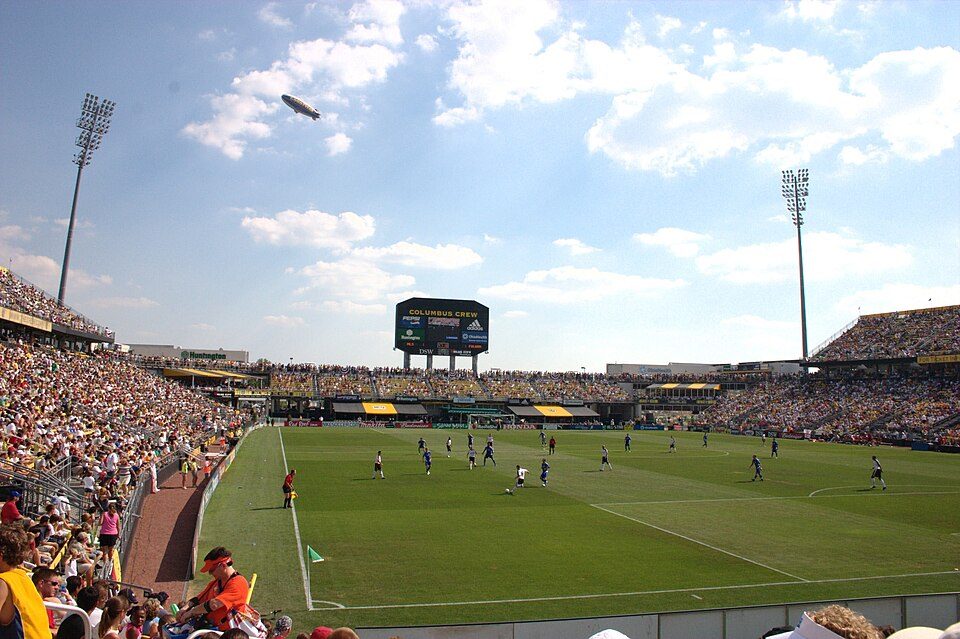 10 mi Stadium & arenaHistoric Crew Stadium
 13 mi Stadium & arenaScottsMiracle-Gro Field
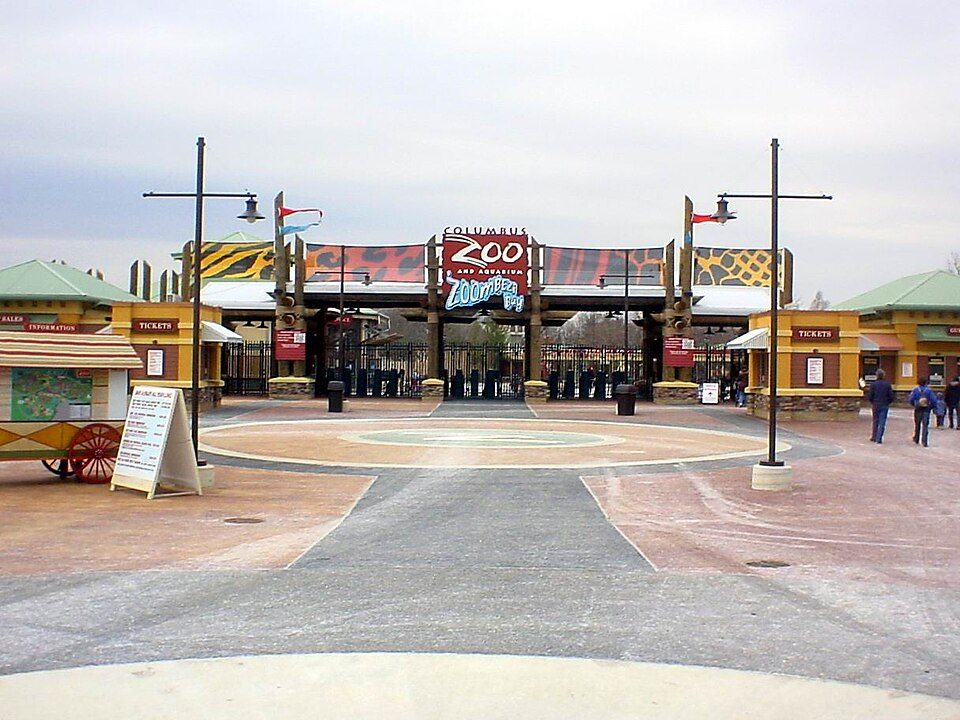 13 mi Zoo & aquariumColumbus Zoo and Aquarium
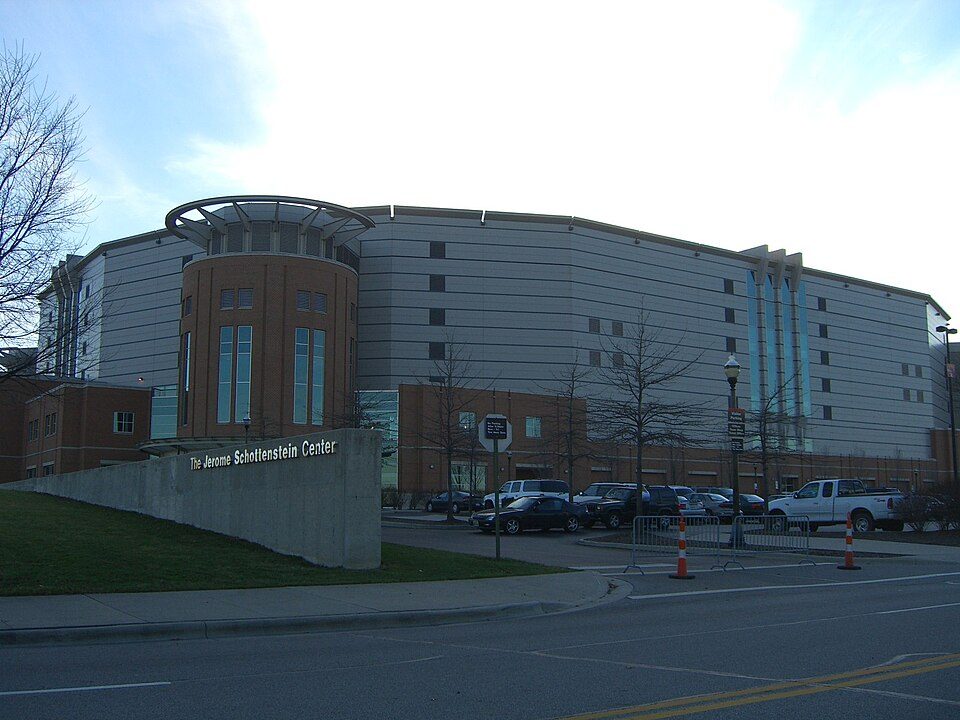 11 mi Stadium & arenaValue City Arena
 11 mi MuseumOhio Governor's Mansion
Ohio Stadium: Lectrician2, CC BY-SA 4.0 · Historic Crew Stadium: Rick Dikeman, CC BY-SA 3.0 · ScottsMiracle-Gro Field: Nova Crystallis, CC BY-SA 4.0 · Columbus Zoo and Aquarium: Adolphus79 at English Wikipedia, Public domain · Value City Arena: Nick81aku at English Wikipedia, Public domain · Ohio Governor's Mansion: Bwsmith84 (talk), CC BY 3.0
Who provides power, water and the rest in Blendon Township, and how to reach them.
EPA SDWIS (Oct 9, 2026) · HIFLD + EIA-861 2025 · Census 2020 ZCTAs · NCES 2024–25 · registration: vote.gov, updated Aug 3, 2026.
Ordered by what stands out in Blendon Township.
Blendon Township is one of Ohio’s best towns for the outdoors and has less tooth loss than most of Ohio, but it carries more natural-hazard risk than most of Ohio (mostly inland flooding).
Its A+ for the outdoors ranks #19 of 993 in Ohio.
5.7 miles of trail in 5 parks and preserves. Blendon Township’s trail density is 0.9 miles per square mile, against 0.2 in Ohio’s towns and 0.4 across U.S. towns.
| Biggest places to walk | Trails | Acres |
|---|---|---|
| 1. Walnut Street Park | 2.3 mi | 164 |
| 2. Hoover Dam Park | 1.5 mi | 670 |
| 3. Blendon Ravines Metro Park | 0.9 mi | 153 |
Trails & parks © OpenStreetMap contributors · Conserved land: USGS PAD-US
Its public schools are run by the Westerville City school district. One of its 6 schools is below, with why it’s listed.
| School | Level | Students | Letter |
|---|---|---|---|
| Minerva Park Middle SchoolLargest public middle schoolGrades 6–8 | Grades 6–8 | 753 | – |
NCES · EDFacts · graded within OH on state tests and graduation
Its widest gap with Ohio is tooth loss: 9.2% of those 65+ have lost all their teeth, against 15.3% statewide.
11% of adults report frequent physical distress in Blendon Township. Blendon Township beats the Ohio average on 21 of 32 CDC measures and trails it on 1. 37% of adults feel lonely in Blendon Township.
| Blendon Township | Ohio towns | U.S. towns | |
|---|---|---|---|
| Frequent physical distress (CDC PLACES) | 11% | 15% | 14% |
| Feel lonely (CDC PLACES) | 37% | 34% | 33% |
| High blood pressure (CDC PLACES) | 31% | 38% | 35% |
| Get no exercise (CDC PLACES) | 20% | 28% | 25% |
| What stands out | Blendon Township | OH |
|---|---|---|
| Fewer older adults who have lost all their teeth | 9.2% | 15.3% |
| Fewer adults with COPD | 5.3% | 8% |
| Fewer adults treating high blood pressure | 76.6% | 79.2% |
CDC PLACES 2025 · modeled estimates for adults · CMS · HRSA
Reported crimes fell from 95 to 42 over the last three FBI years, a drop beyond ordinary year-to-year swings. Violent crime is rare: 5 reported in 2025, 0.6 per 1,000 residents.
The property crime rate in Blendon Township is 4.7 per 1,000 residents.
| Blendon Township | Ohio towns | U.S. towns | |
|---|---|---|---|
| Property crimes per 1,000 (2025) | 4.7 per 1,000 residents | 9.4 | 9.9 |
| Violent crimes per 1,000 (2025) | 0.6 per 1,000 residents | 1.2 | 1.6 |
FBI crime data, 2025 · crimes reported to police
Blendon Township has chilly winters and warm summers. July afternoons reach 85°, January nights drop to 21° and about 19 inches of snow falls in a winter.
NOAA U.S. Climate Normals, 1991–2020
21.8% of workers work from home, against 13% across Ohio.
Most working residents leave Blendon Township for work: only 2% work in town. 22% of Blendon Township workers work from home. Since 2013, Blendon Township has added 614 jobs, to 4,197 in 2023.
| Blendon Township | Ohio towns | U.S. towns | |
|---|---|---|---|
| Work from home | 22% | 9.7% | 11% |
| Median household income | $102,000 | $75,000 | $80,000 |
| Working residents who work in town | 1.9% | 6.9% | 8% |
| Average trip to work | 22 minutes | 24 minutes | 25 minutes |
Census LEHD 2023 · ACS
FEMA rates its natural-hazard risk higher than 91% of Ohio towns, with expected losses of about $429 per resident a year; that rating is what its B− for hazard risk is built on.
Blendon Township’s FEMA risk score is 62 of 100. Since 1979, 3 flood insurance claims have been paid out in Blendon Township.
FEMA flood insurance claims · FEMA National Risk Index · OpenFEMA
14 within 15 miles of the center of Blendon Township
About 6 of every 100 Blendon Township residents are enrolled in college, about the same as Ohio.
9,069 counted in 2010 and 10,152 in 2020; an estimated 9,857 in 2025.
Since 2020 the trend has turned: down 3%, after 11.9% growth in the decade before.
U.S. Census 2010 & 2020 counts · Census Bureau estimate, July 1, 2025
Township in Ohio, US
Blendon Township is one of the seventeen townships of Franklin County, Ohio, United States. The 2020 census found 10,152 people in the township.
From Wikipedia, licensed CC BY-SA 4.0 · facts via Wikidata (CC0)
6 towns share a border with Blendon Township.
| Town | OH rank | Overall | Cost | Safety | Schools | Health |
|---|---|---|---|---|---|---|
| Blendon Township | #204 | A− | C | B+ | B | A− |
| Columbus | #933 | D | C | D | C | B− |
| Westerville | #393 | B+ | C− | C+ | B | A |
| Huber Ridge | #309 | B+ | C+ | — | B | A− |
| Minerva Park | — | — | C | — | B | B |
| Plain Township | #55 | A+ | C− | — | A | A+ |
| Genoa Township | #142 | A | D | A+ | B+ | A |
Minerva Park has fewer than 2,500 residents, so it gets subject grades but no overall grade. Huber Ridge, Minerva Park and Plain Township report no FBI crime data of their own. Compare Blendon Township with a neighbor →
Short answers, built from the data on this page.
By most measures, yes. Blendon Township grades A− overall, better than 82% of U.S. towns and #204 of 987 in Ohio. It grades A− for health, B+ for safety and B for schools.
Cost of living, which also weighs rents, property taxes and how many households pay 30% or more of their income for housing, grades C.


