204 years in pictures
Census counts: 2,514 in 1820, 29,326 in 2020. The archive holds 10 old photos and papers going back to 1866 and 4 maps from 1895 on.
7 places on the National Register of Historic Places.
- 1822Glenville is settled
Each edition grades its towns against each other only.

Glenville grades A− overall, 162nd among New York's 745 graded towns, with clear strengths and some subjects that lag. Residents are healthier than 87% of U.S. towns on CDC estimates and the median household earns $98K. It also does better than most on safety: it reports less crime per resident than 63% of U.S. towns. A typical home there costs about $257K, 2.9 years of the Albany metro’s $88K median household income. Glenville has 7 places on the National Register of Historic Places, among them US Post Office-Scotia Station and Seeley Farmhouse. Glenville is easier to get around on foot or by transit than 75% of U.S. towns. Sanders Preserve, at 389 acres with 5.7 miles of trail, is the biggest park or preserve.
Where Glenville beats most towns.
Census counts: 2,514 in 1820, 29,326 in 2020. The archive holds 10 old photos and papers going back to 1866 and 4 maps from 1895 on.
7 places on the National Register of Historic Places.
Each subject compared with towns across the country (schools within New York), ordered by how far Glenville is from typical.
How TownRatings grades towns →
Museums, parks, gardens and other places to visit around Glenville. Close and well known come first.
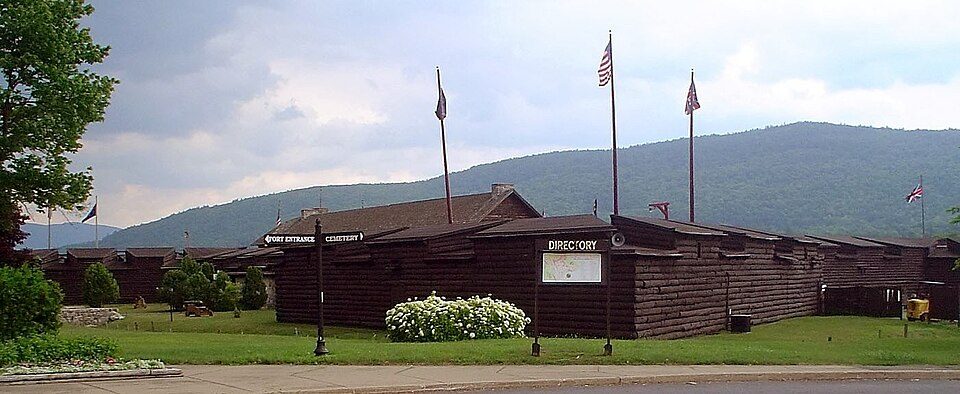
39 mi LandmarkFort William Henry
35 mi Theme parkGreat Escape
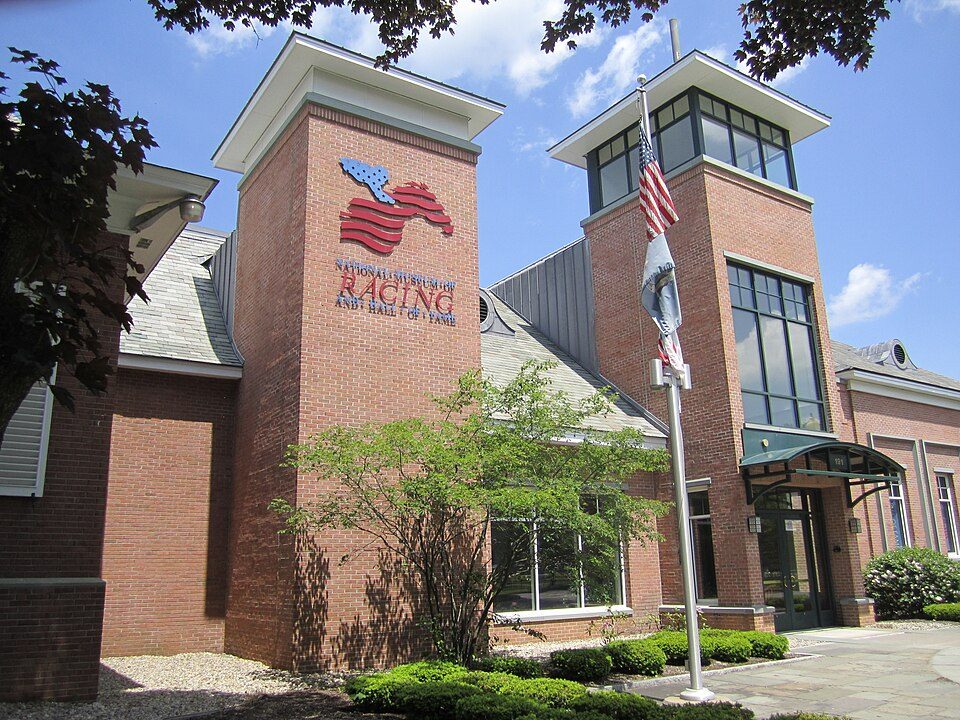
17 mi MuseumNational Museum of Racing and Hall of Fame
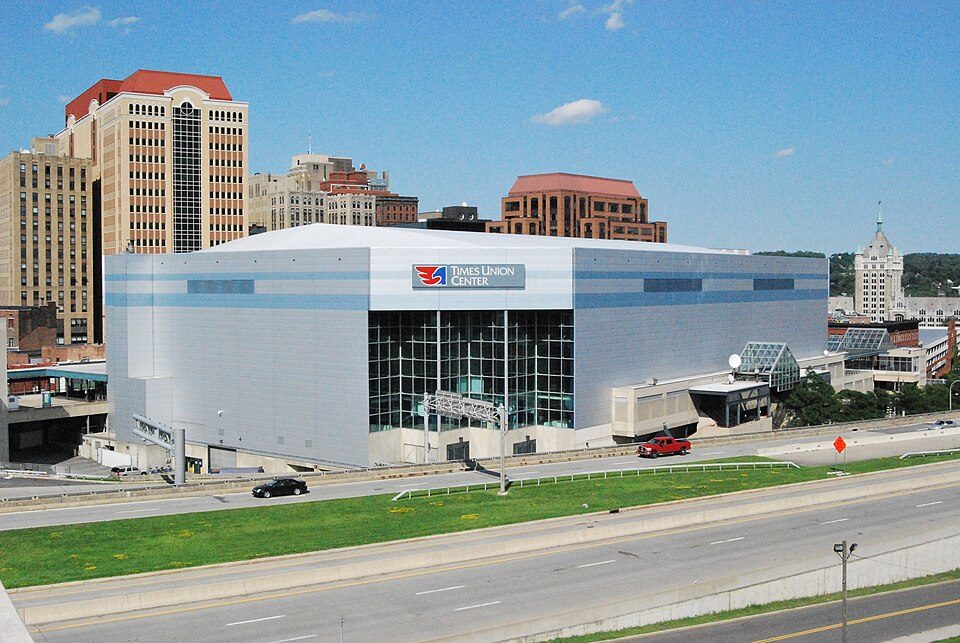
20 mi Stadium & arenaMVP Arena
22 mi MuseumUSS Slater
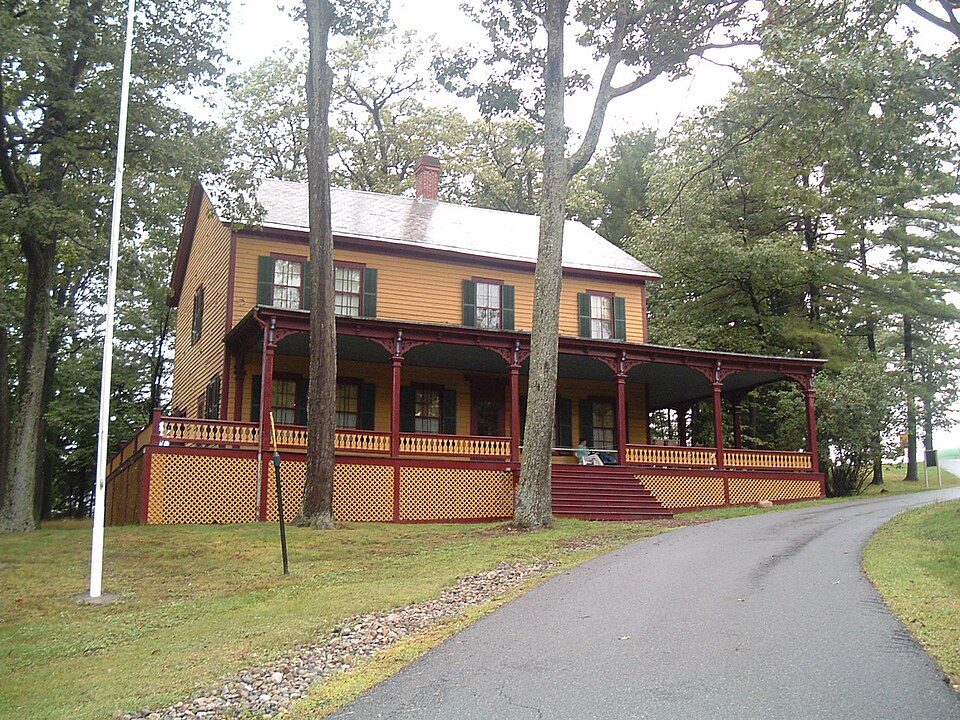
25 mi State parkGrant Cottage State Historic SiteFort William Henry: IrisKawling at en.wikipedia, Public domain · Great Escape: Jared and Corin, CC BY-SA 2.0 · National Museum of Racing and Hall of Fame: Peter Flass, CC BY 3.0 · MVP Arena: This image or media was taken or created by Matt H. Wade. To see his entire port, CC BY-SA 3.0 · USS Slater: UpstateNYer, CC BY-SA 3.0 · Grant Cottage State Historic Site: Coingeek at English Wikipedia, Public domain
Who provides power, water and the rest in Glenville, and how to reach them.
EPA SDWIS (Oct 9, 2026) · HIFLD + EIA-861 2025 · Census 2020 ZCTAs · NCES 2024–25 · registration: vote.gov, updated Aug 3, 2026.
Ordered by what stands out in Glenville.
Glenville reports less crime than Rotterdam or any other graded neighbor, has less food insecurity than most of New York and has commutes shorter than most of New York.
Its widest gap with New York is food insecurity: 10% of its 21,396 adults worry about having enough food, against 17.2% statewide.
14% of adults report frequent mental distress in Glenville, against 16% in New York’s towns and 17% across U.S. towns. 19% of Glenville adults have been diagnosed with depression. Glenville beats the New York average on 13 of 32 CDC measures and trails it on 2.
| Glenville | New York towns | U.S. towns | |
|---|---|---|---|
| Frequent mental distress (CDC PLACES) | 14% | 16% | 17% |
| Depression (CDC PLACES) | 19% | 21% | 23% |
| Smoke cigarettes (CDC PLACES) | 11% | 13% | 14% |
| Get no exercise (CDC PLACES) | 20% | 25% | 25% |
| What stands out | Glenville | NY |
|---|---|---|
| Fewer adults facing food insecurity | 10% | 17.2% |
| Fewer adults facing housing insecurity | 9.2% | 14.5% |
| More adults who have had cancer | 10.3% | 7.7% |
CDC PLACES 2025 · modeled estimates for adults · CMS · HRSA
Its public schools are run by the Scotia-Glenville Central School District. Three of its 10 schools are below, each with why it’s listed.
| School | Level | Students | Letter |
|---|---|---|---|
| Richard H O'Rourke Middle SchoolLargest public middle schoolGrades 6–8 | Grades 6–8 | 704 | B− |
| Scotia-Glenville Senior High SchoolLargest public high schoolGrades 9–12 | Grades 9–12 | 689 | A+ |
| Glendaal SchoolTop results in townGrades K–5 | Grades K–5 | 224 | A− |
NCES · EDFacts · graded within NY on state tests and graduation
| Glenville | New York towns | U.S. towns | |
|---|---|---|---|
| Miles of trail per square mile | 0.5 miles per square mile | 0.4 | 0.4 |
| Conserved land | 4.4% | 5.2% | 4.3% |
| Biggest places to walk | Trails | Acres |
|---|---|---|
| 1. Sanders Preserve | 5.7 mi | 389 |
| 2. Indian Meadows Park | 4.6 mi | 188 |
| 3. Indian Kill Nature Preserve | 4.3 mi | 134 |
Trails & parks © OpenStreetMap contributors · Conserved land: USGS PAD-US
The average commute for its 14,205 working residents takes 24.2 minutes, against 32.6 across New York.
Most working residents leave Glenville for work: only 10% work in town. 4.6% of residents live below the poverty line in Glenville, where New York’s towns sit at 9.5% and U.S. towns at 9.6%. Since 2013, Glenville has added 1,081 jobs, to 8,645 in 2023.
| Glenville | New York towns | U.S. towns | |
|---|---|---|---|
| Below the poverty line | 4.6% | 9.5% | 9.6% |
| Median household income | $98,000 | $82,000 | $80,000 |
| Work from home | 15% | 12% | 11% |
Census LEHD 2023 · ACS
Glenville has cold, snowy winters and pleasant summers. July afternoons reach 82°, January nights drop to 14° and about 64 inches of snow falls in a winter.
NOAA U.S. Climate Normals, 1991–2020
Expected storm and flood damage is lower than in 65% of U.S. communities. Since 1978, 34 flood insurance claims have been paid out in Glenville.
FEMA flood insurance claims · FEMA National Risk Index · OpenFEMA
Its B tops all 3 graded towns on its borders; Rotterdam (C+) comes closest. At 13.8 crimes per 1,000 residents a year, it reports more crime than 51% of New York’s graded towns.
FBI crime data, 2025 · crimes reported to police
People 65 and older are 23% of residents (18% statewide). 42% of adults 25 and older hold a bachelor’s degree or more in Glenville.
| Glenville | New York towns | U.S. towns | |
|---|---|---|---|
| Bachelor’s degree or more, 25+ | 42% | 32% | 29% |
| Aged 65 or older | 23% | 20% | 18% |
| Median age | 43.6 years | 42.9 years | 40.5 years |
| Under 18 | 21% | 20% | 22% |
53% women, 47% men
About 89 men for every 100 women (the survey’s margin: ±1.7 points). Across New York, 51.2% of residents are women. Median age: women 44.8, men 41.4.
| Glenville | NY | U.S. | |
|---|---|---|---|
| Under 10 | 10.3% | 11% | 11.6% |
| 10 to 17 | 10.2% | 9.5% | 10.3% |
| 18 to 24 | 8% | 8.9% | 9.1% |
| 25 to 34 | 11.9% | 14.2% | 13.7% |
| 35 to 44 | 12% | 13% | 13.2% |
| 45 to 54 | 12.3% | 12.2% | 12.2% |
| 55 to 64 | 12.3% | 13.3% | 12.7% |
| 65 to 74 | 12.3% | 10.3% | 10.2% |
| 75 and older | 10.6% | 7.6% | 7% |
| No diploma | 4.6% | 12% | 10.4% |
| High school | 22.4% | 24.3% | 26% |
| Some college | 17.6% | 14.6% | 19.1% |
| Associate’s | 13.6% | 8.8% | 8.8% |
| Bachelor’s | 23.4% | 22.4% | 21.6% |
| Graduate | 18.3% | 17.9% | 14.1% |
U.S. Census Bureau · ACS 2020-2024 5-year estimates
The median sale price was $308,000 in May 2026.
Zillow Home Value Index · Redfin Data Center
3 within 15 miles of the center of Glenville
About 5 of every 100 Glenville residents are enrolled in college, against 7 across New York.
Where Glenville’s working residents go each day. Line width shows the share.
Census LEHD 2023
7 places in Glenville on the National Register of Historic Places.
7 towns share a border with Glenville.
| Town | NY rank | Overall | Cost | Safety | Schools | Health |
|---|---|---|---|---|---|---|
| Glenville | #162 | A− | C+ | B | B | A |
| Rotterdam | #271 | B+ | C+ | C+ | B | A− |
| Charlton | #164 | A− | C+ | — | A− | A− |
| East Glenville | — | — | — | — | — | — |
| Niskayuna | #131 | A | C− | C+ | A− | A |
| Amsterdam | #664 | D | B− | — | D | B− |
| Schenectady | #729 | D− | C+ | D | D | C |
| Ballston | #128 | A | C− | — | B+ | A |
Charlton, Amsterdam and Ballston report no FBI crime data of their own. East Glenville isn’t graded (fewer than 1,000 residents, or not enough data). Compare Glenville with a neighbor →
Short answers, built from the data on this page.
By most measures, yes. Glenville grades A− overall, better than 81% of U.S. towns and #162 of 745 in New York. It grades A for health, B for safety and B for schools.
The typical home is worth about $257,000, 51% below the New York typical home. Cost of living, which also weighs rents, property taxes and how many households pay 30% or more of their income for housing, grades C+.