120 years in pictures
The archive holds 4 old photos and papers going back to 2004 and 3 maps from 1953 on.
3 places on the National Register of Historic Places.
- 1906La Cienega is settled
Each edition grades its towns against each other only.

A town of 3,543, settled in 1906.
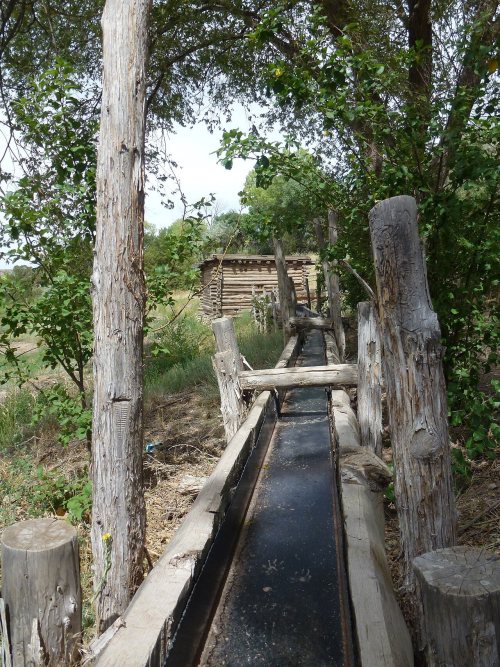
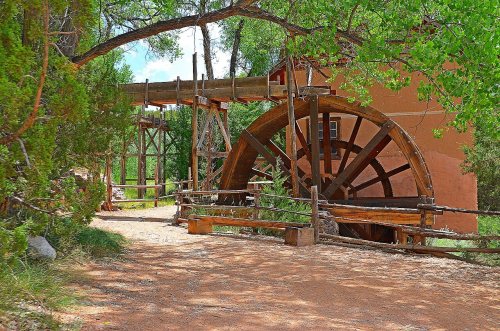
La Cienega grades B overall, ranked 4th of 72 in New Mexico, with clear strengths and some subjects that lag. Residents are healthier than 86% of U.S. towns on CDC estimates and it has 15 miles of trail and 34% conserved land. It also does better than most on incomes: the median household earns $85K. Its lowest everyday mark is in cost of living: the typical home is worth about $517K, 6.5 years of the Santa Fe metro’s $79K median household income. 34% of the land in La Cienega is conserved, against 3.8% in New Mexico’s towns and 4.3% across U.S. towns. La Cienega has 3 places on the National Register of Historic Places, among them El Rancho de las Golondrinas and J.B. Jackson House.
Where La Cienega beats most towns.
| Widest gap | La Cienega | NM |
|---|---|---|
| Fewer older adults who have lost all their teeth | 7.5% | 14.2% |
Where La Cienega’s working residents go each day. Line width shows the share.
Census LEHD 2023
Each subject compared with towns across the country (schools within New Mexico), ordered by how far La Cienega is from typical.
How TownRatings grades towns →
The archive holds 4 old photos and papers going back to 2004 and 3 maps from 1953 on.
3 places on the National Register of Historic Places.
Museums, parks, gardens and other places to visit around La Cienega. Close and well known come first.
13 mi National MonumentBandelier National Monument248K visitors a year
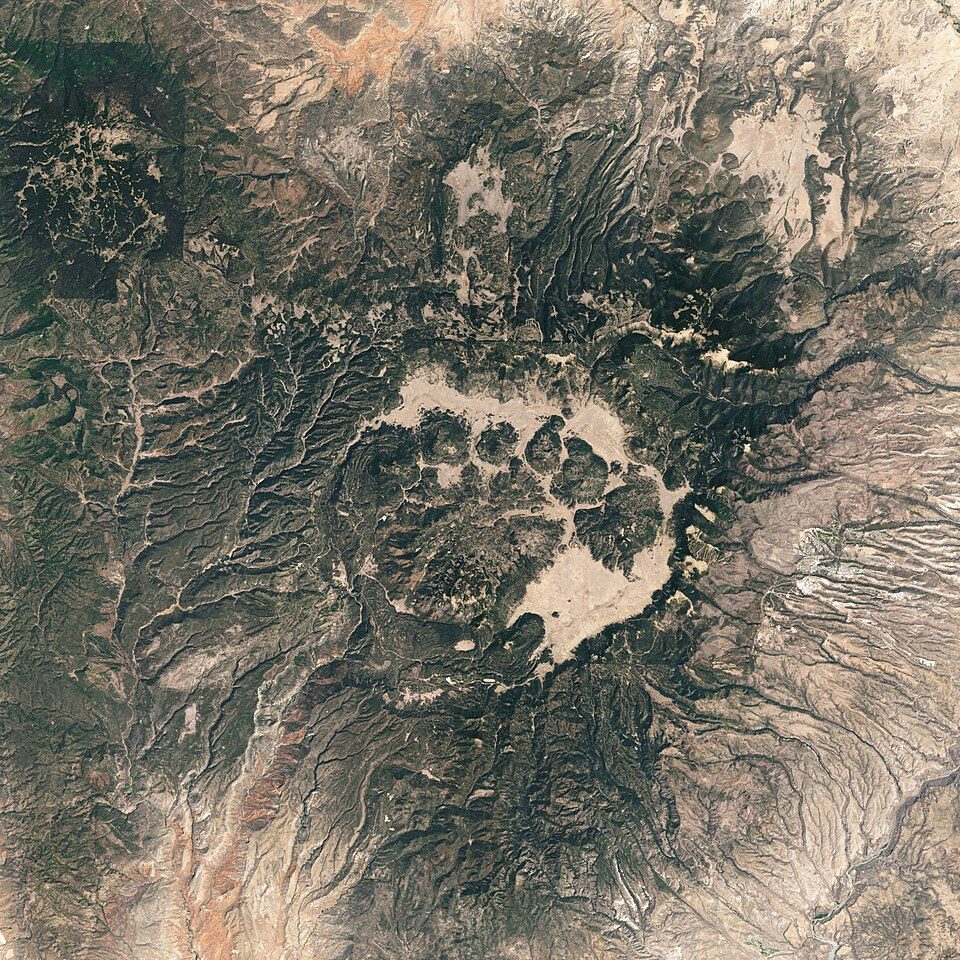
25 mi National PreserveValles Caldera National Preserve85K visitors a year
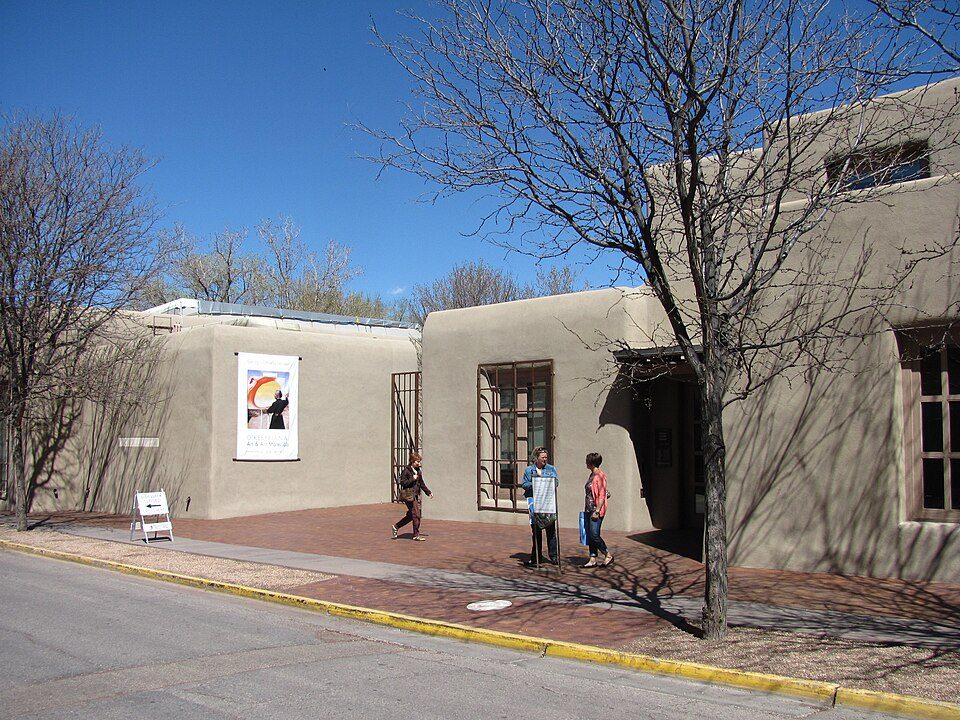
12 mi MuseumGeorgia O'Keeffe Museum
16 mi National Historical ParkPecos National Historical Park37K visitors a year
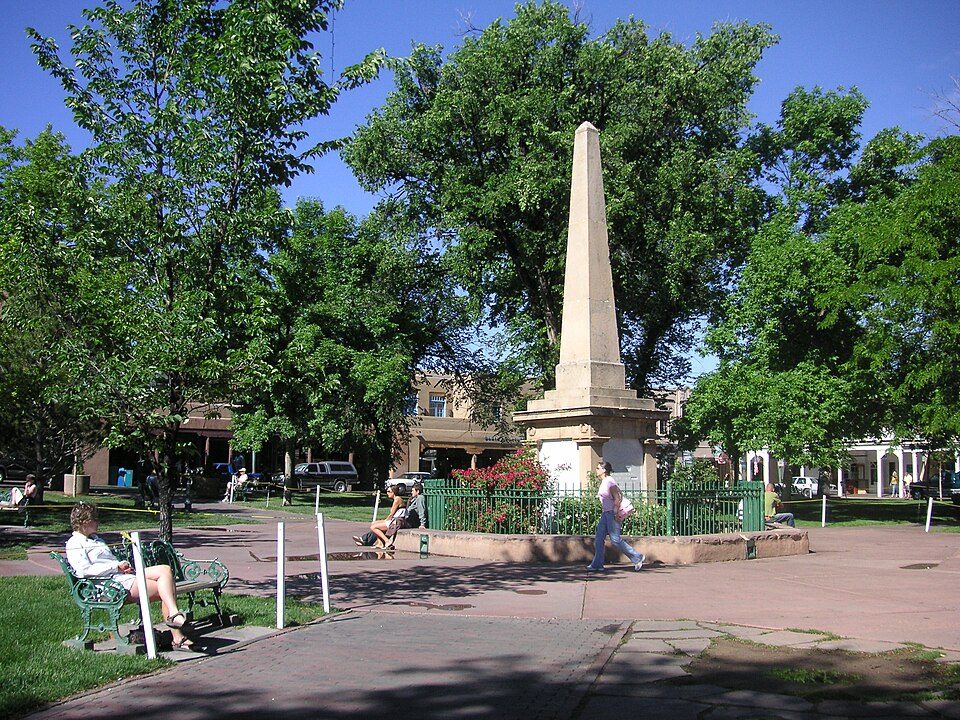
12 mi Park & preserveSanta Fe Plaza
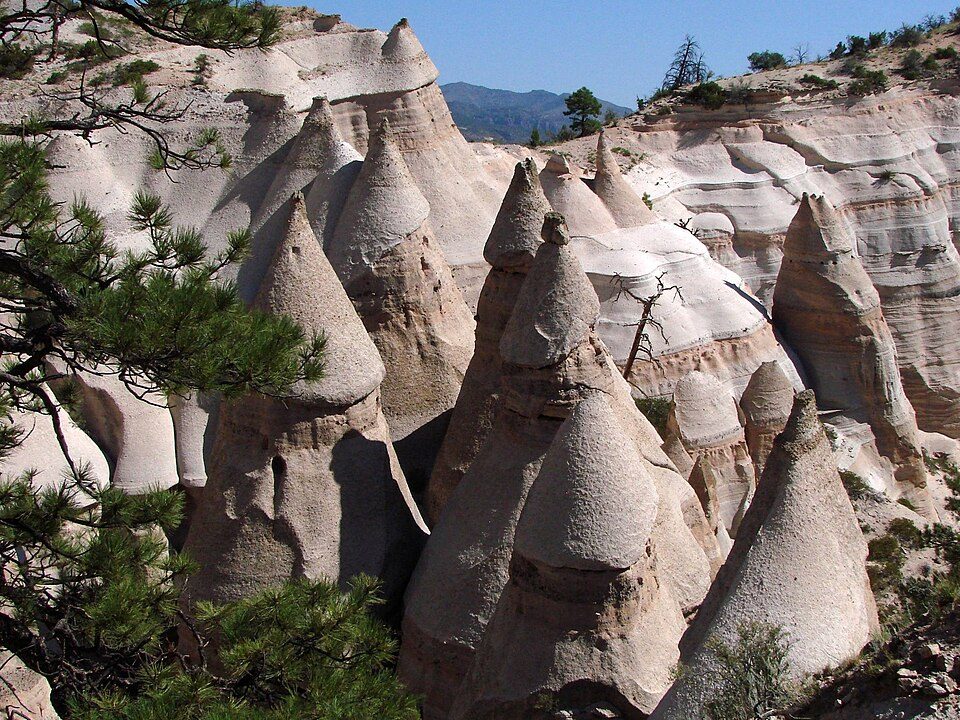
18 mi Park & preserveKasha-Katuwe Tent Rocks National MonumentBandelier National Monument: Andrew Dunn (talk · contribs), CC BY-SA 2.0 · Valles Caldera National Preserve: Jesse Allen and Robert Simmon, Public domain · Georgia O'Keeffe Museum: John Phelan, CC BY 3.0 · Pecos National Historical Park: Mosamiazaz at English Wikipedia, Public domain · Santa Fe Plaza: See above, CC BY 2.0 · Kasha-Katuwe Tent Rocks National Monument: Marshallhenrie, CC BY-SA 4.0
La Cienega is unincorporated, so Santa Fe County and regional agencies provide most services.
EPA SDWIS (Oct 9, 2026) · HIFLD + EIA-861 2025 · Census 2020 ZCTAs · NCES 2024–25 · registration: vote.gov, updated Aug 27, 2026.
Ordered by what stands out in La Cienega.
La Cienega keeps more of its land conserved than most of New Mexico and has less tooth loss than most of New Mexico, but it has homes that cost more against local pay than most of New Mexico.
Its 2,555 conserved acres are a larger share of the town than in 93% of New Mexico towns.
Leonora Curtin Wetland Preserve, at 197 acres with 1.3 miles of trail, is the biggest park or preserve. 2 parks and preserves cover 389 acres in La Cienega.
| Biggest places to walk | Trails | Acres |
|---|---|---|
| 1. El Rancho de las Golondrinas | 2 mi | 192 |
| 2. Leonora Curtin Wetland Preserve | 1.3 mi | 197 |
Trails & parks © OpenStreetMap contributors · Conserved land: USGS PAD-US
Its widest gap with New Mexico is tooth loss: 7.5% of those 65+ have lost all their teeth, against 14.2% statewide.
12% of La Cienega adults report frequent physical distress, where New Mexico’s towns sit at 17% and U.S. towns at 14%. Only 3 of the 73 New Mexico towns we compare have a lower share of adults who have been diagnosed with depression than La Cienega. On top of that, la Cienega: 27% of adults have high blood pressure.
| La Cienega | New Mexico towns | U.S. towns | |
|---|---|---|---|
| Obesity (CDC PLACES) | 26% | 35% | 35% |
| Frequent mental distress (CDC PLACES) | 13% | 16% | 17% |
| High blood pressure (CDC PLACES) | 27% | 35% | 35% |
| Yearly checkup (CDC PLACES) | 68% | 69% | 79% |
| What stands out | La Cienega | NM |
|---|---|---|
| Fewer older adults who have lost all their teeth | 7.5% | 14.2% |
| Fewer adults with COPD | 3.8% | 6.6% |
CDC PLACES 2025 · modeled estimates for adults · CMS · HRSA
Half commute less than 11 miles. Jobs in La Cienega grew by 266 from 2013 to 2023, reaching 495. Most working residents leave La Cienega for work: only 3% work in town. The share of residents in La Cienega who live below the poverty line: 10%.
| La Cienega | New Mexico towns | U.S. towns | |
|---|---|---|---|
| Working residents who work in town | 3.2% | 15% | 8% |
| Below the poverty line | 10% | 21% | 9.6% |
| Median household income | $85,000 | $55,000 | $80,000 |
| Work from home | 13% | 8.4% | 11% |
Census LEHD 2023 · ACS
La Cienega’s age of the median resident is 44.2 years. Adults 35 to 64 are nearly half of residents (37% statewide); adults 18 to 34 are 16% of residents (23% statewide). 17% of residents are under 18 in the town. A bachelor’s degree or higher: 34% of adults 25 and older, vs 31% across New Mexico.
| La Cienega | New Mexico towns | U.S. towns | |
|---|---|---|---|
| Under 18 | 17% | 24% | 22% |
| Median age | 44.2 years | 37.2 years | 40.5 years |
| Aged 65 or older | 17% | 18% | 18% |
49% women, 51% men
That’s an even split within the survey’s margin of ±5.5 points. Across New Mexico, 50.3% of residents are women.
| La Cienega | NM | U.S. | |
|---|---|---|---|
| Under 10 | 7% | 11% | 11.6% |
| 10 to 17 | 10.4% | 10.7% | 10.3% |
| 18 to 24 | 8.3% | 9.3% | 9.1% |
| 25 to 34 | 8.1% | 13.2% | 13.7% |
| 35 to 44 | 17.2% | 12.8% | 13.2% |
| 45 to 54 | 16.5% | 11.2% | 12.2% |
| 55 to 64 | 15.6% | 12.5% | 12.7% |
| 65 to 74 | 7.5% | 11.5% | 10.2% |
| 75 and older | 9.3% | 7.8% | 7% |
| No diploma | 10.4% | 12% | 10.4% |
| High school | 27.4% | 25.7% | 26% |
| Some college | 20.7% | 22.2% | 19.1% |
| Associate’s | 8% | 9.2% | 8.8% |
| Bachelor’s | 18.2% | 17.1% | 21.6% |
| Graduate | 15.4% | 13.9% | 14.1% |
U.S. Census Bureau · ACS 2020-2024 5-year estimates · in a town of 3,500, single groups can be off by several points
The natural-hazard score from FEMA for La Cienega comes to 69 of 100. Of the losses FEMA expects in the town, 63% come from inland flooding and 30% from wildfires.
FEMA National Risk Index · OpenFEMA
For La Cienega, the typical July afternoon high is 89°F.
NOAA U.S. Climate Normals, 1991–2020
At 6.5 years of the Santa Fe metro’s $79K median household income, the typical home costs more against local pay than in 88% of New Mexico towns; that ratio is one input to its C+ for cost of living.
In La Cienega, four in five households live in a home they own. The midpoint rent in the town is $1,139 a month.
| La Cienega | New Mexico towns | U.S. towns | |
|---|---|---|---|
| Households that own their home | 80% | 70% | 73% |
| Median rent | $1,139 a month | $936 a month | $1,185 a month |
Census ACS, 2020–24 · Zillow Home Value Index · Redfin Data Center
5 within 15 miles of the center of La Cienega
About 1 of every 100 La Cienega residents are enrolled in college, against 6 across New Mexico.
3 places in La Cienega on the National Register of Historic Places.
Census-designated place in New Mexico, United States
La Cienega is a census-designated place (CDP) in Santa Fe County, New Mexico, United States. It is part of the Santa Fe, New Mexico, metropolitan statistical area. As of the 2020 census, La Cienega had a population of 3,885. La Cienega is located on the site of a Keres pueblo that took part in the 1680 Pueblo Revolt.
From Wikipedia, licensed CC BY-SA 4.0 · facts via Wikidata (CC0)
One town shares a border with La Cienega.
| Town | NM rank | Overall | Cost | Safety | Schools | Health |
|---|---|---|---|---|---|---|
| La Cienega | #4 | B | C+ | — | B | A |
| Santa Fe | #22 | C | C− | D− | B | A− |
La Cienega reports no FBI crime data of its own. Compare La Cienega with a neighbor →
Short answers, built from the data on this page.
By most measures, yes. La Cienega grades B overall, better than 56% of U.S. towns and #4 of 72 in New Mexico. It grades A for health and B for schools.
The typical home is worth about $517,000, 64% above the New Mexico typical home. Cost of living, which also weighs rents, property taxes and how many households pay 30% or more of their income for housing, grades C+.