
Toas, 2014
Marmora’s story
136 years in pictures
The archive holds 6 old photos and papers going back to 2014.
- 1890Marmora is settled
Each edition grades its towns against each other only.

A town of 2,039, settled in 1890.
38% of residents are 65 or older in Marmora, above both the New Jersey town median (18%) and the median of U.S. towns (18%). Among 469 New Jersey towns, just 10 have a higher median age than Marmora. We don’t grade Marmora yet; the figures below are still real.
Coastal flooding makes up 15% of the storm damage FEMA expects here.
FEMA National Risk Index · OpenFEMA · OpenStreetMap
The archive holds 6 old photos and papers going back to 2014.
Museums, parks, gardens and other places to visit around Marmora. Close and well known come first.
 Big draw34 mi Park & preservePine Barrens
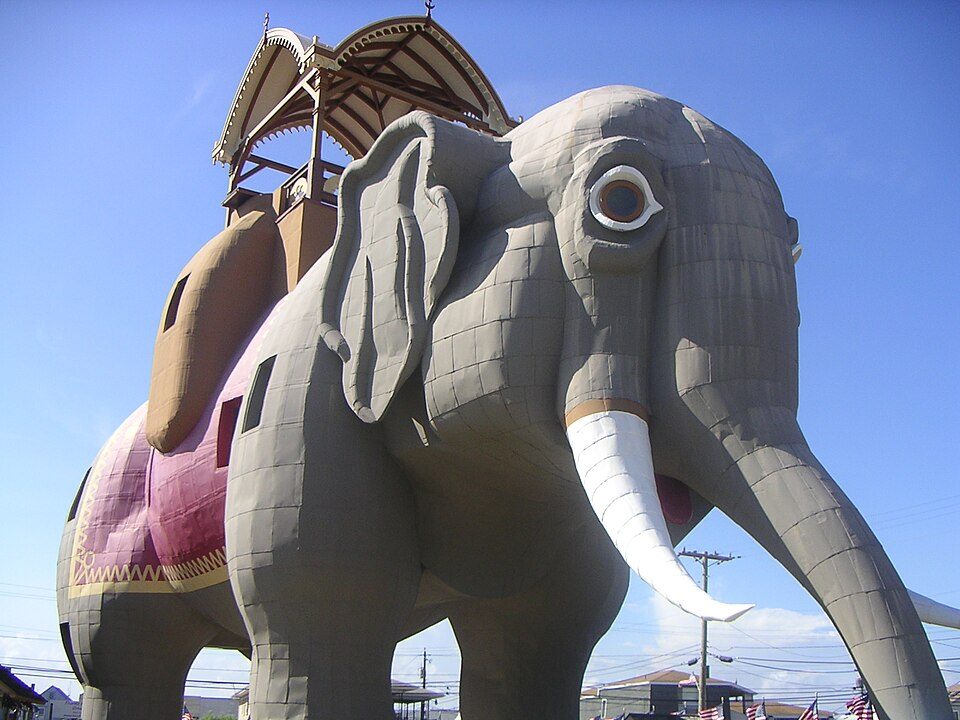 9 mi LandmarkLucy the Elephant
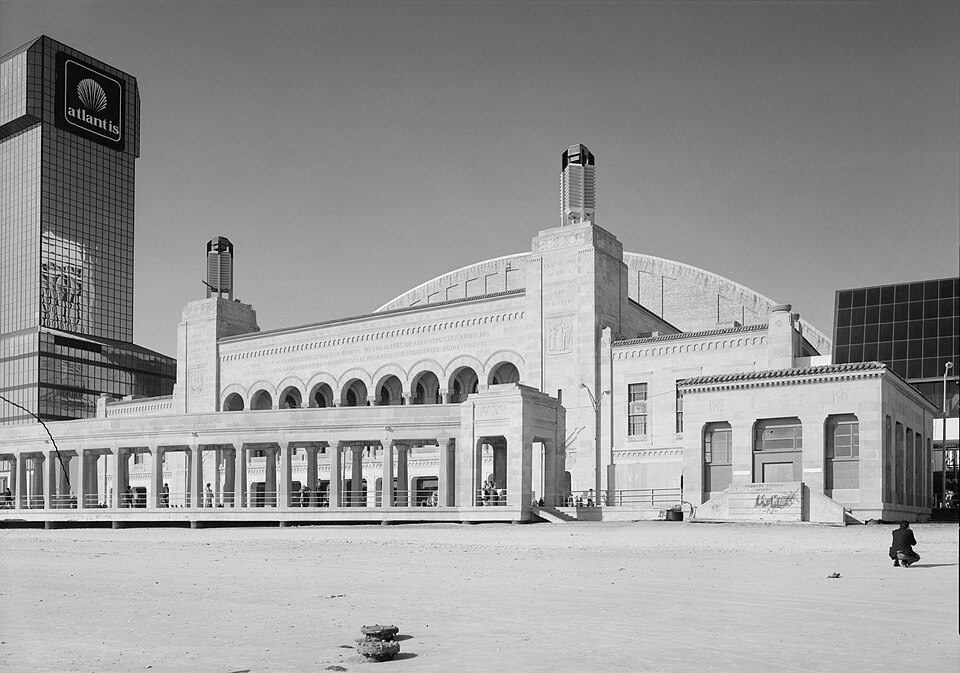 14 mi Stadium & arenaBoardwalk Hall
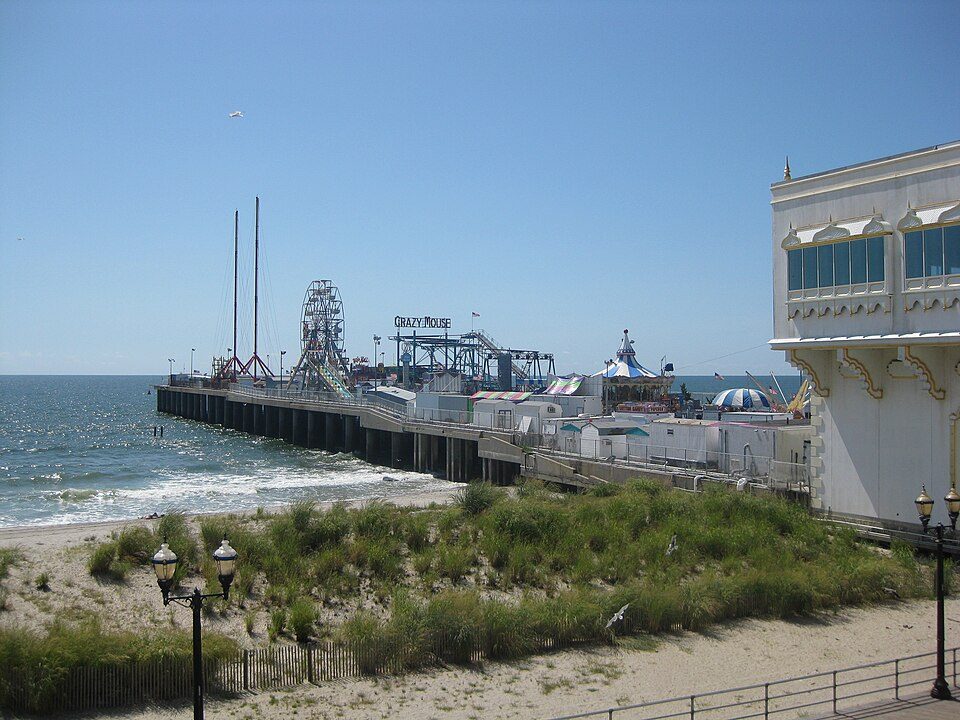 15 mi Theme parkSteel Pier
 5 mi Theme parkGillians Wonderland Pier and Island Waterpark38 mi BeachLong Beach Island
Pine Barrens: Famartin, CC BY-SA 4.0 · Lucy the Elephant: User:dtcdthingy 3:30 pm 30th July 2004 (Minolta Dimage X20), Public domain · Boardwalk Hall: Jack Boucher, Public domain · Steel Pier: Make Lemons, CC BY-SA 2.0 · Gillians Wonderland Pier and Island Waterpark: Kevin Jarrett from Northfield, NJ, USA, CC BY 2.0
Marmora is unincorporated, so Cape May County and regional agencies provide most services.
EPA SDWIS (Oct 9, 2026) · HIFLD + EIA-861 2025 · Census 2020 ZCTAs · NCES 2024–25 · registration: vote.gov, updated Nov 18, 2024.
Ordered by what stands out in Marmora.
People 65 and older are 38% of residents (17% statewide); adults 18 to 34 are 10% of residents (21% statewide). 42% of Marmora adults 25 and older hold a bachelor’s degree or more, against 45% in New Jersey’s towns and 29% across U.S. towns.
Somewhere between 38% and 70% women
The Census survey reached too few of Marmora’s residents to say more: its margin here is ±15.8 points. Across New Jersey, 50.8% of residents are women.
| Marmora | NJ | U.S. | |
|---|---|---|---|
| Under 10 | 7.5% | 11.6% | 11.6% |
| 10 to 17 | 7.5% | 10.2% | 10.3% |
| 18 to 24 | 5.1% | 8.4% | 9.1% |
| 25 to 34 | 5.3% | 12.9% | 13.7% |
| 35 to 44 | 12.5% | 13.3% | 13.2% |
| 45 to 54 | 8.3% | 12.9% | 12.2% |
| 55 to 64 | 15.5% | 13.5% | 12.7% |
| 65 to 74 | 20.7% | 10% | 10.2% |
| 75 and older | 17.5% | 7.2% | 7% |
| No diploma | 3.2% | 9.3% | 10.4% |
| High school | 29.3% | 25.3% | 26% |
| Some college | 11.5% | 15% | 19.1% |
| Associate’s | 14% | 6.7% | 8.8% |
| Bachelor’s | 22.1% | 26.1% | 21.6% |
| Graduate | 19.8% | 17.6% | 14.1% |
U.S. Census Bureau · ACS 2020-2024 5-year estimates · in a town of 2,000, single groups can be off by several points
Marmora has chilly winters and pleasant summers. Marmora’s July high is 84°F.
NOAA U.S. Climate Normals, 1991–2020
Expected storm and flood damage is higher than in 66% of U.S. communities.
FEMA National Risk Index · OpenFEMA
Most working residents leave Marmora for work: only 4% work in town. The average trip to work in Marmora is 23 minutes. Jobs based in Marmora grew to 925 in 2023, 136 more than in 2013.
| Marmora | New Jersey towns | U.S. towns | |
|---|---|---|---|
| Average trip to work | 23 minutes | 30 minutes | 25 minutes |
| Below the poverty line | 3.9% | 6.1% | 9.6% |
| Median household income | $106,000 | $113,000 | $80,000 |
| Working residents who work in town | 3.7% | 6.3% | 8% |
Census LEHD 2023 · ACS
29% of Marmora adults sleep under 7 hours. Marmora beats the New Jersey average on 15 of 32 CDC measures and trails it on 2. 17% of Marmora adults get no exercise outside work.
| Marmora | New Jersey towns | U.S. towns | |
|---|---|---|---|
| Feel lonely (CDC PLACES) | 27% | 32% | 33% |
| Sleep under 7 hours (CDC PLACES) | 29% | 36% | 36% |
| Get no exercise (CDC PLACES) | 17% | 22% | 25% |
| Fair or poor health (CDC PLACES) | 12% | 15% | 19% |
| What stands out | Marmora | NJ |
|---|---|---|
| Fewer adults facing food insecurity | 6.7% | 14.3% |
| Fewer uninsured adults | 5.3% | 11.3% |
| More adults who have had cancer | 10.3% | 7.5% |
CDC PLACES 2025 · modeled estimates for adults · CMS · HRSA
The typical Marmora home is worth about $508,000, up 7.6% in a year, 12% below the New Jersey typical home. 88% of households own their home in Marmora.
Census ACS, 2020–24 · Zillow Home Value Index · Redfin Data Center
1 within 15 miles of the center of Marmora
About 5 of every 100 Marmora residents are enrolled in college, about the same as New Jersey.
Populated place in Cape May County, New Jersey, US
Marmora is an unincorporated community and census-designated place (CDP) in Upper Township, in Cape May County, in the U.S. state of New Jersey. It is part of the Ocean City Metropolitan Statistical Area. Its postal ZIP Code is 08223. As of the 2020 census, Marmora had a population of 2,413. A post office was established in 1890, with James Corson as the first postmaster.
From Wikipedia, licensed CC BY-SA 4.0 · facts via Wikidata (CC0)
2 towns share a border with Marmora.
| Town | NJ rank | Overall | Cost | Safety | Schools | Health |
|---|---|---|---|---|---|---|
| Marmora | — | — | — | — | — | — |
| Palermo | — | — | — | — | — | — |
| Beesleys Point | — | — | — | — | — | — |
Marmora, Palermo and Beesleys Point aren’t graded (fewer than 1,000 residents, or not enough data). Compare Marmora with a neighbor →
Short answers, built from the data on this page.
We don’t grade Marmora yet; the figures below are still real.


