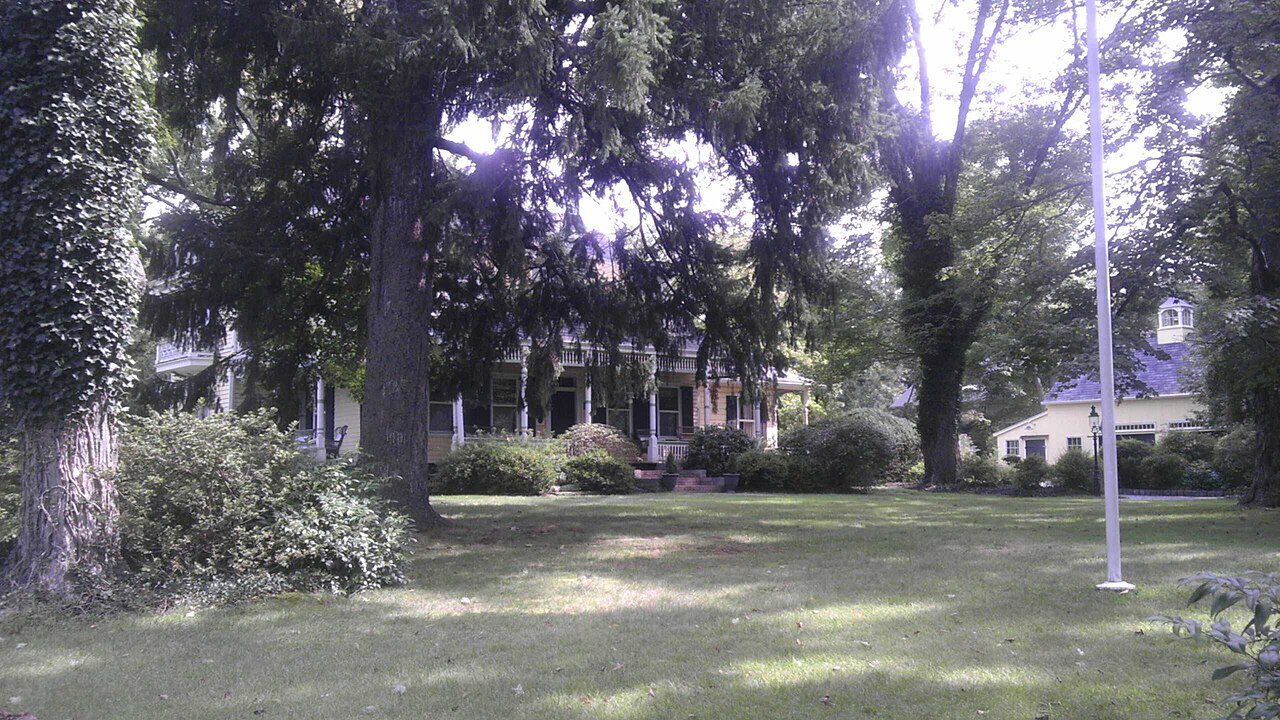
 John Jacob Bogert House · Photo: jim.henderson · CC BY-SA 3.0
On CDC estimates, Harrington Park is among the healthiest U.S. towns
Harrington Park differs from New Jersey on 21 of 32 measures CDC estimates: 19 better, 2 worse.
Modeled estimates for adults 18+, CDC’s own estimate for Harrington Park. How CDC estimates town health
What stands out about health in Harrington Park
Harrington Park keeps up with checkups
It beats New Jersey on four of five routine checkups and screenings, including yearly checkups (80.8% vs 78%) and dentist visits (76.9% vs 65.9%). Checkups ↓
Harrington Park is an active town
Only 17.4% of adults get no exercise outside work, vs 24.8% across New Jersey. Habits ↓
Few Harrington Park adults smoke
6.7% of adults smoke cigarettes, vs 10.9% across New Jersey. Habits ↓
Written from the CDC, Medicare and HRSA data on this page. CDC PLACES 2025 release: modeled estimates for adults, not counts; “higher” and “lower” mean the New Jersey figure falls outside Harrington Park’s likely range.
What’s behind Harrington Park’s grade
On seven CDC estimates for adults, Harrington Park is among the healthiest U.S. towns, #47 of 468 in New Jersey. All seven estimates beat the typical U.S. town. The strongest is smoking (fewer adults who smoke than 98% of towns); the weakest is no exercise, still better than 93%.
Health estimates follow income closely across the country: towns with higher household incomes usually score higher (a correlation of 0.77 across 21,157 graded towns). Harrington Park’s median household income is $180,500; among the 1,347 U.S. towns within 25% of that ($135K–$226K), it’s healthier than 89%, about where its income would put it.
Keeping up with care
Share of Harrington Park adults getting routine care. The full ring is 100%; the dark tick marks New Jersey.
Everyday habits, side by side with New Jersey
Share of adults, with the New Jersey figure marked.
1.9 miles of trails across 3 parks and preserves
Out of every 100 Harrington Park adults…
Harrington Park runs below NJ on 5 of 12 conditions and above it on 2. Tap one to see it as people.
Care in and near Harrington Park
No hospital or community health center in Harrington Park itself. These are the nearest.
Hospitals: Medicare overall star ratings, 1–5. Community health centers charge on a sliding scale by income. Distances are straight-line from the center of Harrington Park; ≈ marks a hospital located by its town, not its street. Shortage areas: HRSA Health Professional Shortage Areas.
How Harrington Park adults are doing
On 1 of 4 measures, Harrington Park does better than New Jersey.
1 in 3 Harrington Park adults feel lonely. A hello is a start.
Groups are the easiest way in: a walking group, a book club, your street.
If you or someone you know is struggling, call or text 988, the Suicide & Crisis Lifeline. It’s free, confidential and open 24/7.
Making ends meet
Needs that shape health as much as any doctor visit: food, housing, utilities and a way to get around.
3.2% of Harrington Park adults receive SNAP (food stamps), compared with 8.4% across New Jersey.
Harrington Park and the towns around it
Harrington Park’s Health Grade ranks 2nd of 6 graded towns around it.
Nearby towns are shaded from CDC’s estimates for their ZIP codes, or CDC’s own figure for cities and villages.
Health next door
| Town | Health | Obesity | Diabetes | Smoking | Figures from |
|---|---|---|---|---|---|
| Harrington Park | A+ | 22.6% | 8.7% | 6.7% | CDC place |
| Closter | A+ | 21.8% | 9.2% | 7.3% | CDC place |
| River Vale Township | A+ | 23.8% | 8.2% | 7.1% | ZIP 07675 |
| Norwood | A+ | 21.5% | 9.6% | 7% | CDC place |
| Emerson | A+ | 23.9% | 8% | 7.3% | CDC place |
| Old Tappan | A+ | 20.7% | 8.2% | 5.6% | CDC place |
Same-state neighbors only, ordered by length of shared border.
Living with a disability
Shown without a better/worse judgment.
of Harrington Park adults live with a disability (New Jersey 24.8%). Walking or climbing stairs is the most common.
Every CDC estimate for Harrington Park
Share of adults, 40 measures, with CDC’s likely range.
On the 32 measures below that have a better and a worse direction, Harrington Park is better than New Jersey on 19 and worse on 2; on the rest, the New Jersey figure falls inside Harrington Park’s likely range, so we call them about the same. Disability and SNAP are described, not compared as better or worse.
| Adults who… | Harrington Park | NJ | U.S. | vs NJ |
|---|---|---|---|---|
| Overall health | ||||
| Fair or poor health | 11.4%9.7–13.6 | 17.1% | 19.4% | Better |
| Frequent physical distress (physical health not good 14+ days a month) | 9.3%8.1–10.8 | 12.2% | 13% | Better |
| Frequent mental distress (mental health not good 14+ days a month) | 12.3%10.8–14.1 | 14.7% | 15.9% | Better |
| Conditions | ||||
| Obesity | 22.6%19.4–26.2 | 28.9% | 32.9% | Better |
| Diabetes | 8.7%7.6–10 | 10.9% | 12% | Better |
| High blood pressure | 32.3%29.6–35.3 | 32.8% | 34.4% | About the same |
| High cholesterol (adults screened in 5 years) | 42.6%39.5–45.6 | 39.3% | 37.1% | Worse |
| Arthritis | 21.3%19.2–23.6 | 22.2% | 25.3% | About the same |
| Asthma | 7.9%7.1–8.9 | 8.9% | 9.9% | About the same |
| Cancer, other than skin cancer | 9%8.2–10 | 7.5% | 7.9% | Worse |
| Coronary heart disease | 5.1%4.5–5.8 | 5.6% | 6.4% | About the same |
| COPD | 4%3.2–5 | 5.1% | 6.3% | Better |
| Stroke | 2.6%2.2–3 | 3.1% | 3.4% | Better |
| Lost all teeth (ages 65+) | 4.6%3.7–5.7 | 9.6% | 12.3% | Better |
| Habits | ||||
| Smoke cigarettes | 6.7%5.2–8.7 | 10.9% | 11.8% | Better |
| No exercise outside work | 17.4%14.7–20.6 | 24.8% | 24.7% | Better |
| Binge drinking | 15.3%13.2–17.6 | 15.5% | 15.4% | About the same |
| Sleep under 7 hours | 34.6%30.7–38.5 | 37.5% | 36% | About the same |
| Checkups and coverage | ||||
| No health insurance (ages 18–64) | 5.1%4–6.5 | 11.3% | 11% | Better |
| Checkup in the past year | 80.8%78.2–83.2 | 78% | 77.4% | Better |
| Dentist visit in the past year | 76.9%74.3–79.2 | 65.9% | 63.2% | Better |
| Cholesterol check in 5 years | 92.4%91–93.5 | 89.1% | 87.1% | Better |
| Taking blood pressure medicine (adults with high blood pressure) | 78.9%76–81.5 | 77.2% | 76.5% | About the same |
| Colorectal cancer screening (ages 45–75) | 68%64.1–71.6 | 63.4% | 65.5% | Better |
| Mammogram in 2 years (women 50–74) | 77.7%71.6–82.8 | 75.7% | 76.4% | About the same |
| Mind and connection | ||||
| Ever told they have depression | 14.1%12.3–16.2 | 15.1% | 20.6% | About the same |
| Feel lonely | 30.9%27.1–34.6 | 32.4% | 32.5% | About the same |
| Lack social and emotional support | 21.2%18–24.3 | 24% | 23.6% | About the same |
| Everyday needs | ||||
| Worried about having enough food | 6.5%4.8–8.4 | 14.3% | 15% | Better |
| Worried about keeping housing | 6%4.7–7.5 | 12.3% | 12% | Better |
| Threatened with a utility shut-off | 3.5%2.8–4.3 | 7% | 7.6% | Better |
| Lack reliable transportation | 4%3.2–4.8 | 7.4% | 7.9% | Better |
| Received SNAP (food stamps) | 3.2%2.2–4.4 | 8.4% | 11.6% | Lower |
| Disability | ||||
| Any disability | 18.7%16.3–21.8 | 24.8% | 30.1% | Lower |
| Difficulty walking or climbing stairs | 8.5%7–10.2 | 11.3% | 13.6% | Lower |
| Difficulty concentrating or remembering | 7.8%6.7–9.4 | 11.5% | 13.9% | Lower |
| Hearing difficulty | 5.3%4.7–6.1 | 5.7% | 6.7% | About the same |
| Vision difficulty | 2.9%2.5–3.4 | 4.7% | 5.4% | Lower |
| Difficulty doing errands alone | 4.6%3.9–5.5 | 6.6% | 7.9% | Lower |
| Difficulty dressing or bathing | 2.2%1.8–2.6 | 3.3% | 3.8% | Lower |
Each figure is the share of adults 18+ unless the label says otherwise; small numbers after it are CDC’s likely range (95% interval). “About the same” means the New Jersey figure falls inside that range.
Questions about health in Harrington Park
Is Harrington Park a healthy place to live?
On seven CDC estimates for adults, Harrington Park is among the healthiest U.S. towns: A+ for health, #47 of 468 in New Jersey. Among U.S. towns with similar household incomes it’s healthier than 89%. These are modeled estimates of who lives there, not a measure of local care or habits alone.
What is the obesity rate in Harrington Park?
CDC estimates 22.6% of adults have obesity, likely between 19.4% and 26.2%, against 28.9% across New Jersey and 32.9% nationally.
What hospital is closest to Harrington Park?
Hackensack Meridian Health Pascack Valley Medical in Westwood, 1.8 miles in a straight line from Harrington Park’s center point, is the nearest general hospital with an emergency room; Medicare rates it 5 of 5 stars.
How many people in Harrington Park have no health insurance?
CDC estimates 5.1% of adults ages 18–64 have no health insurance (likely 4–6.5%), against 11.3% across New Jersey.
How accurate are these numbers?
They’re modeled estimates: CDC applies national survey answers to each area’s age, sex, race and education mix, so they describe who lives in Harrington Park more than anything measured there. At the ends of CDC’s ranges the grade could be anywhere from A to A+.
Neighbors talk health
Doctors taking patients, urgent care, staying active in Harrington Park.
Health estimates: CDC PLACES: Local Data for Better Health, 2025 release. The New Jersey figure combines its counties, weighted by adult population. Hospitals and star ratings: Medicare Care Compare (CMS). Health centers and shortage areas: HRSA. The Health Grade is our own summary of CDC’s estimates, not an official rating. Ages: U.S. Census Bureau, American Community Survey. Town boundaries: U.S. Census Bureau. This page isn’t medical advice. In an emergency, call 911.