162 years in pictures
Census counts: 1,023 in 1870, a low of 581 in 1930, 4,893 in 2020. The archive holds 12 old photos and papers going back to 2005 and 4 maps from 1891 on.
- 1864Hampton Township is settled
Each edition grades its towns against each other only.

Hampton Township's standout: it has 17 miles of trail and 39% conserved land. Overall it grades B−, ranked 309th of 466 in New Jersey. It is healthier than 80% of U.S. towns. Its weakest subject is cost of living: the typical home is worth about $337K, 3.4 years of the New York metro’s $99K median household income. 39% of the land in Hampton Township is conserved, above both the New Jersey town median (11%) and the median of U.S. towns (4.3%). Only 26 of New Jersey’s 530 towns score lower on history. The biggest park or preserve is Bear Swamp Wildlife Management Area, at 1,432 acres.
Where Hampton Township beats most towns.
Where Hampton Township’s working residents go each day. Line width shows the share.
Census LEHD 2023
Each subject compared with towns across the country (schools within New Jersey), ordered by how far Hampton Township is from typical.
How TownRatings grades towns →
Census counts: 1,023 in 1870, a low of 581 in 1930, 4,893 in 2020. The archive holds 12 old photos and papers going back to 2005 and 4 maps from 1891 on.
Museums, parks, gardens and other places to visit around Hampton Township. Close and well known come first.
30 mi LandmarkDrew University
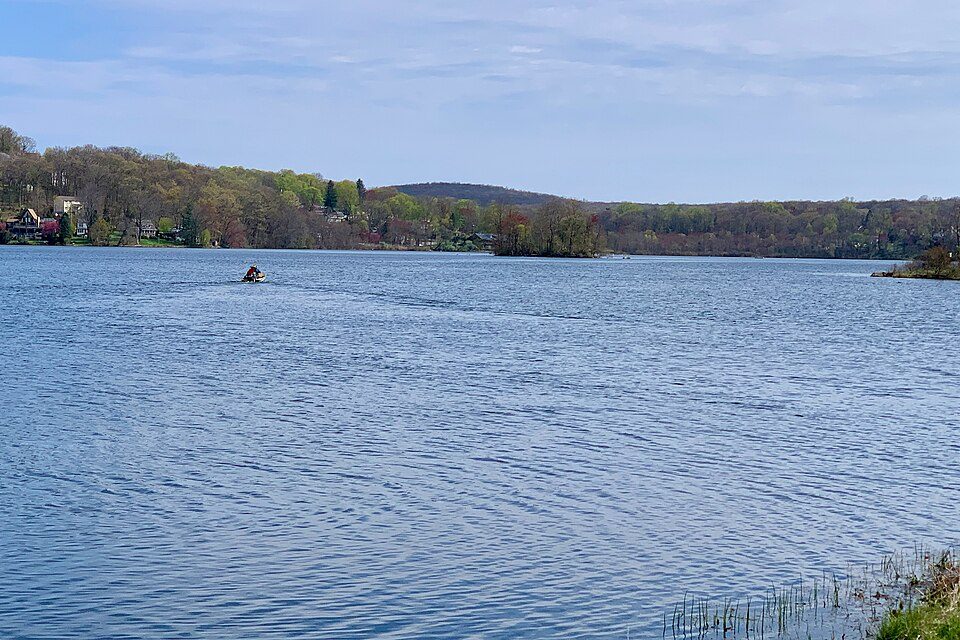
14 mi LakeLake Musconetcong
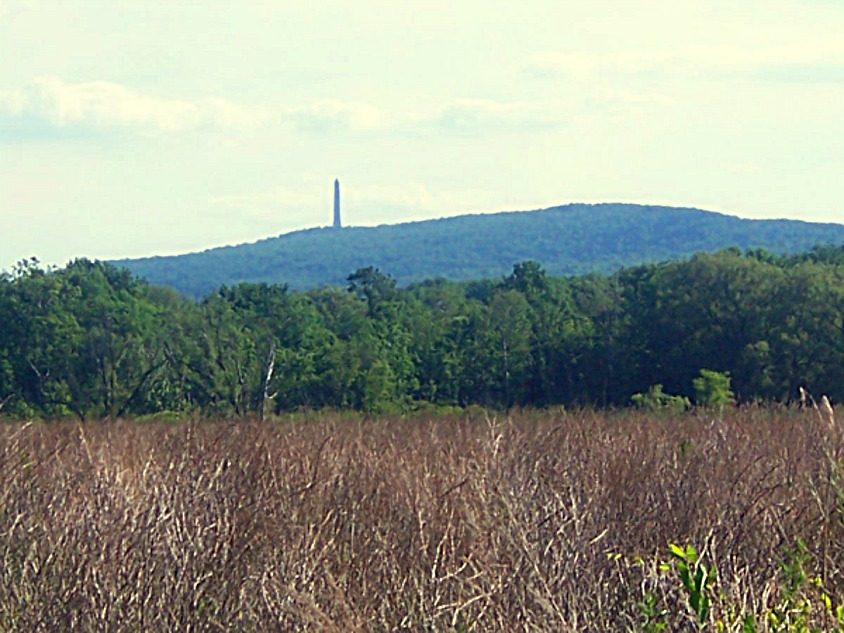
17 mi MountainHigh Point
7 mi National park siteMiddle Delaware National Scenic River4.1M visitors a year
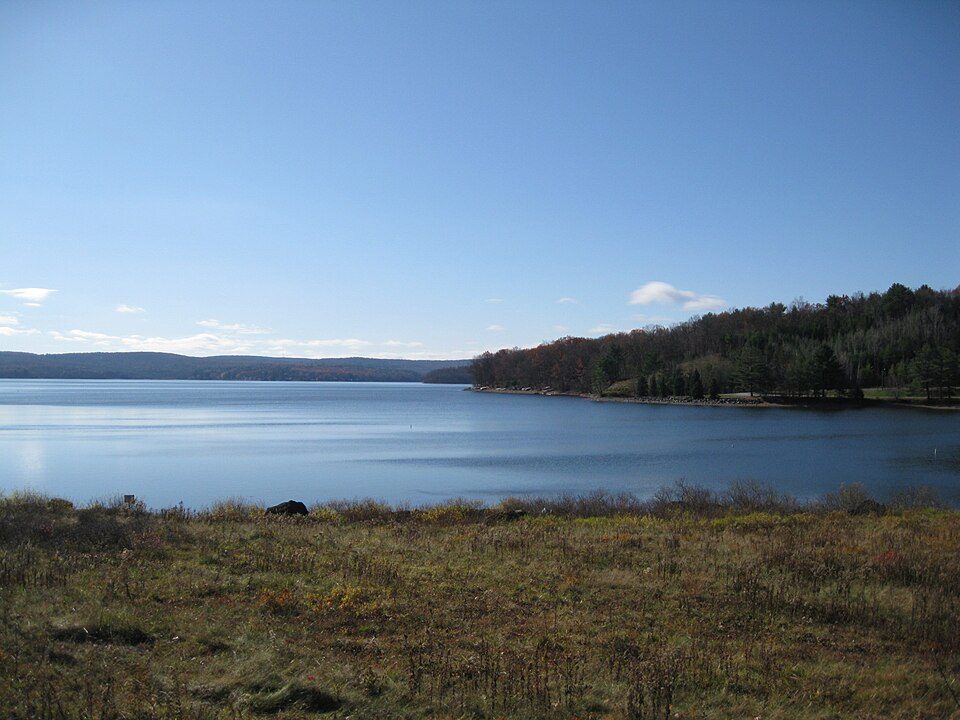
32 mi LakeLake Wallenpaupack
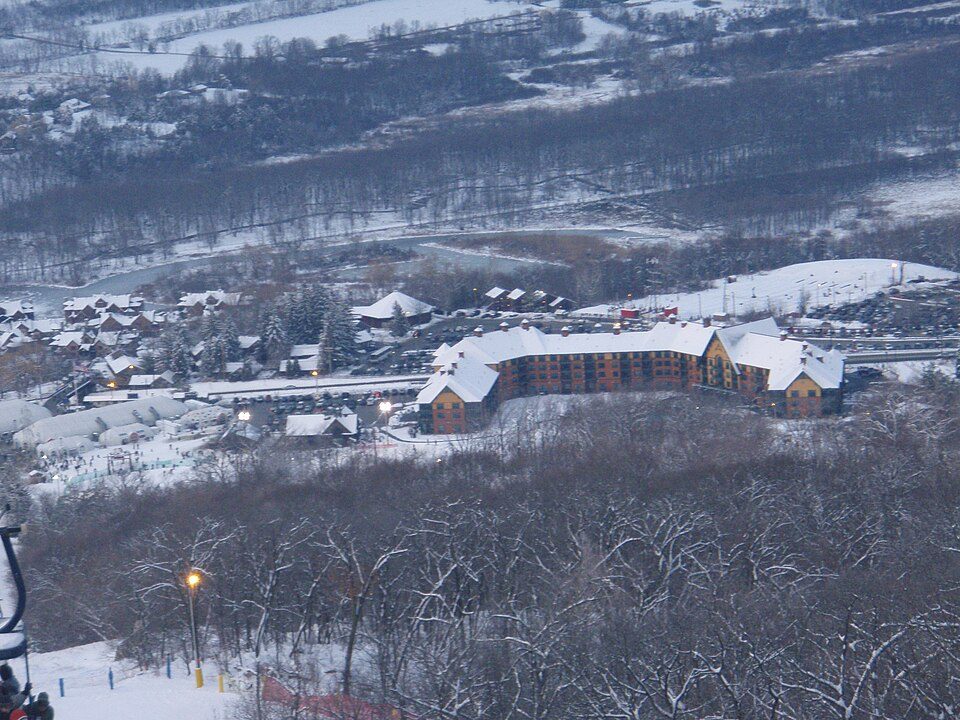
16 mi Ski areaMountain Creek44 runs · 1,001 ft verticalDrew University: CUBJONES83 (talk), Public domain · Lake Musconetcong: Zeete, CC BY-SA 4.0 · High Point: Daniel Case, CC BY-SA 3.0 · Middle Delaware National Scenic River: Mike Serfas, Public domain · Lake Wallenpaupack: Doug Kerr from Albany, NY, United States, CC BY-SA 2.0 · Mountain Creek: NHRHS2010, CC BY-SA 3.0
Who provides power, water and the rest in Hampton Township, and how to reach them.
EPA SDWIS (Oct 9, 2026) · HIFLD + EIA-861 2025 · Census 2020 ZCTAs · NCES 2024–25 · registration: vote.gov, updated Nov 18, 2024.
Ordered by what stands out in Hampton Township.
Hampton Township keeps more of its land conserved than most of New Jersey and is healthy by national standards but mid-pack in New Jersey.
Its 6,267 conserved acres are a larger share of the town than in 93% of New Jersey towns.
Walkers can cover 17 miles of trail in 8 parks and preserves. Hampton Township’s trail network density is 0.7 miles per square mile, close to New Jersey’s towns (0.7) and above U.S. towns (0.4).
| Biggest places to walk | Trails | Acres |
|---|---|---|
| 1. Swartswood State Park | 4.2 mi | 585 |
| 2. Paulinskill River Wildlife Management Area | 1 mi | 1,404 |
| 3. Hampton Township Park | 0.5 mi | 14 |
Trails & parks © OpenStreetMap contributors · Conserved land: USGS PAD-US
The largest public high school is Kittatinny Regional High School, with 733 students. Public schools: the Kittatinny Regional School District. Two of the 3 schools are below, and why each made the list.
| School | Level | Students | Letter |
|---|---|---|---|
| Marian E. McKeown Elementary SchoolLargest public elementary schoolGrades PK–6 | Grades PK–6 | 322 | B |
| Kittatinny Regional High SchoolLargest public high schoolGrades 7–12 | Grades 7–12 | 733 | B |
NCES · EDFacts · graded within NJ on state tests and graduation
Within New Jersey it is less healthy than 61% of the 468 graded towns: New Jersey sets a high bar.
Hampton Township beats the New Jersey average on 6 of 32 CDC measures and trails it on 5. Among adults locally, 19% have been diagnosed with depression. In Hampton Township, 28% of adults have obesity, and 15% report frequent mental distress.
| Hampton Township | New Jersey towns | U.S. towns | |
|---|---|---|---|
| Depression (CDC PLACES) | 19% | 16% | 23% |
| Obesity (CDC PLACES) | 28% | 28% | 35% |
| Frequent mental distress (CDC PLACES) | 15% | 15% | 17% |
| Smoke cigarettes (CDC PLACES) | 12% | 11% | 14% |
| What stands out | Hampton Township | NJ |
|---|---|---|
| Fewer uninsured adults | 8.3% | 11.3% |
| Fewer adults facing food insecurity | 10.8% | 14.3% |
| More adults who have had cancer | 9.6% | 7.5% |
CDC PLACES 2025 · modeled estimates for adults · CMS · HRSA
It had 1,603 jobs in 2023, down 315 from 2013. Hampton Township’s income of the median household stands at $110,000. For half of commuters, work is under 21 miles away. 20% of workers do their job from home locally.
| Hampton Township | New Jersey towns | U.S. towns | |
|---|---|---|---|
| Work from home | 20% | 16% | 11% |
| Average trip to work | 31 minutes | 30 minutes | 25 minutes |
| Median household income | $110,000 | $113,000 | $80,000 |
| Below the poverty line | 6.2% | 6% | 9.6% |
Census LEHD 2023 · ACS
Four-year graduates: 41% of adults 25 and older here, 44% across New Jersey. People 65 and older are 27% of residents (17% statewide); adults 18 to 34 are 13% of residents (21% statewide). For Hampton Township, the age of the median resident is 50.5 years.
| Hampton Township | New Jersey towns | U.S. towns | |
|---|---|---|---|
| Median age | 50.5 years | 42 years | 40.5 years |
| Aged 65 or older | 27% | 18% | 18% |
| Bachelor’s degree or more, 25+ | 41% | 45% | 29% |
| Under 18 | 20% | 21% | 22% |
51% women, 49% men
That’s an even split within the survey’s margin of ±2.7 points. Across New Jersey, 50.8% of residents are women.
| Hampton Township | NJ | U.S. | |
|---|---|---|---|
| Under 10 | 9.9% | 11.6% | 11.6% |
| 10 to 17 | 10.2% | 10.2% | 10.3% |
| 18 to 24 | 5.3% | 8.4% | 9.1% |
| 25 to 34 | 7.8% | 12.9% | 13.7% |
| 35 to 44 | 11.1% | 13.3% | 13.2% |
| 45 to 54 | 10.9% | 12.9% | 12.2% |
| 55 to 64 | 17.9% | 13.5% | 12.7% |
| 65 to 74 | 14.2% | 10% | 10.2% |
| 75 and older | 12.7% | 7.2% | 7% |
| No diploma | 4.9% | 9.3% | 10.4% |
| High school | 31.4% | 25.3% | 26% |
| Some college | 14.6% | 15% | 19.1% |
| Associate’s | 8% | 6.7% | 8.8% |
| Bachelor’s | 23.2% | 26.1% | 21.6% |
| Graduate | 17.9% | 17.6% | 14.1% |
U.S. Census Bureau · ACS 2020-2024 5-year estimates · in a town of 5,000, single groups can be off by several points
The range runs from 18° on a January night to 84° on a July afternoon, with about 39 inches of snow a winter.
NOAA U.S. Climate Normals, 1991–2020
Households in Hampton Township have drawn federal disaster aid in 5 declared disasters, most recently in 2012. Expected storm and flood damage is lower than in nearly two thirds of U.S. communities. Flood insurance has paid one claim locally since 1979.
FEMA disaster declarations and aid · FEMA National Risk Index · OpenFEMA
The share of households in Hampton Township who live in a home they own: 87%. The typical rent locally is $1,680 a month.
| Hampton Township | New Jersey towns | U.S. towns | |
|---|---|---|---|
| Households that own their home | 87% | 77% | 73% |
| Median rent | $1,680 a month | $1,780 a month | $1,185 a month |
Census ACS, 2020–24 · Zillow Home Value Index · Redfin Data Center
1 within 15 miles of the center of Hampton Township
About 3 of every 100 Hampton Township residents are enrolled in college, against 6 across New Jersey.
Township in Sussex County, New Jersey, US
Hampton Township is a township in Sussex County, in the U.S. state of New Jersey. As of the 2020 United States census, the township's population was 4,893, a decrease of 303 (−5.8%) from the 2010 census count of 5,196, which in turn reflected an increase of 253 (+5.1%) from the 4,943 counted in the 2000 census. Hampton Township was formed from portions of Sussex County by an act of the New Jersey Legislature on April 11, 1864. The township was named for Jonathan Hampton, who donated land in 1769 to the Episcopal Church of Newton. State legislator Robert Hamilton, an Episcopalian, appreciated Hampton's generosity, and gave the township its name. Portions of the township were taken on Februar…
From Wikipedia, licensed CC BY-SA 4.0 · facts via Wikidata (CC0)
5 towns share a border with Hampton Township.
| Town | NJ rank | Overall | Cost | Safety | Schools | Health |
|---|---|---|---|---|---|---|
| Hampton Township | #309 | B− | C− | — | B− | A− |
| Stillwater Township | #292 | B− | C | — | B | A− |
| Lafayette Township | — | — | C− | — | C+ | A− |
| Fredon Township | #166 | A− | B− | — | B− | A− |
| Andover Township | #107 | A | C− | A+ | B+ | A |
| Frankford Township | #319 | C+ | C− | — | B− | A− |
Lafayette Township has fewer than 2,500 residents, so it gets subject grades but no overall grade. Hampton Township, Stillwater Township, Lafayette Township, Fredon Township and Frankford Township report no FBI crime data of their own. Compare Hampton Township with a neighbor →
Short answers, built from the data on this page.
Hampton Township grades B− overall, better than 46% of U.S. towns and #309 of 466 in New Jersey. It grades A− for health and B− for schools. Cost of living is its weak spot, with a C−.
Yes. The typical home is worth about $337,000, 41% below the New Jersey typical home. Cost of living, which also weighs rents, property taxes and how many households pay 30% or more of their income for housing, grades C−.