Guest, Sign inJoin

Post to Richmond

We’ll email a one-tap link to publish your post. No password, and nothing is public until you click it.
Already a member? Sign in
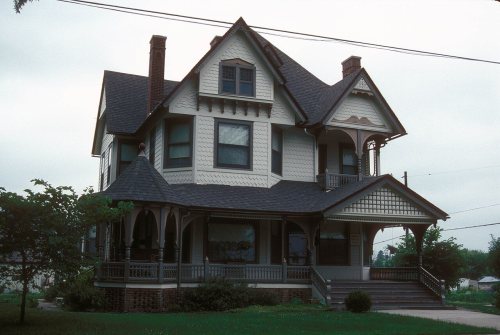
RAY COUNTY COURTHOUSE
Missouri›Ray County

RichmondMO

87% more nonprofits per person than the typical Missouri town.

Trash day: look up yours
1 bordering townMap →
Photo: JERRYE & ROY KLOTZ MD · CC BY-SA 3.0
Photo of Richmond

Richmond, MO · Photo: JERRYE & ROY KLOTZ MD · CC BY-SA 3.0 · Source ↗

Is Richmond a good place to live?

Richmond gives you more for your money than most places: homes are within reach, about $236K for a typical one, or 2.8 years of the Kansas City metro’s $83K median household income. It grades C overall, ranked 163rd of 247 in Missouri. The low prices come with trade-offs. CDC estimates put its residents' health behind 90% of the country and its schools rank behind 78% of the state's. On the plus side, it is more walkable than 78% of U.S. towns. Richmond’s average commute is 35 minutes, above both Missouri’s towns (22 minutes) and U.S. towns (25 minutes). On hazard risk, just 14 of Missouri’s 419 towns do better. Richmond's civic life (library use, community groups, volunteering) is stronger than in 95% of U.S. towns.

What makes Richmond stand out

Where Richmond beats most towns.

How Richmond grades

Each subject compared with towns across the country (schools within Missouri), ordered by how far Richmond is from typical.

How grading works

Character Graded, but not part of the overall grade.
Described, not graded Taste, not quality: snow or an older crowd is neither good nor bad.

How TownRatings grades towns →

Ray County Poor Farm
Ray County Poor Farm · National Register of Historic Places
Richmond’s story

198 years in pictures

Census counts: 615 in 1860, 6,013 in 2020. The archive holds 6 old photos and papers going back to 2007 and 4 maps from 1889 on.

4 places on the National Register of Historic Places.

  • 1828Richmond is settled
Explore the history →
Getting set up

Moving to Richmond: who provides what

Who provides power, water and the rest in Richmond, and how to reach them.

The full setup list →
PowerEvergy12.1¢/kWh · EIA 2025HIFLD · EIA
WaterRichmond PWS1 health-based violation in 5 years · EPAEPA
Internet6 providers100% of addresses get 100/20 MbpsFCC
Trash & dumpBy addressDay by addressTown site
SchoolsRichmond R-XVI School DistrictWhich school depends on your addressNCES
Register to voteOnlineIn Missouri you can register online until 27 days before Election Day, in person until 27 days before Election Day, or by mail (postmarked 27 days before).vote.gov
Who runs elections hereRayRay County; contacts on the Handbook page.FVAP, Oct 2022
ZIP code6408564085 100%Census 2020

EPA SDWIS (Oct 9, 2026) · HIFLD + EIA-861 2025 · Census 2020 ZCTAs · NCES 2024–25 · registration: vote.gov, updated Nov 18, 2024.

The data

Ordered by what stands out in Richmond.

Richmond trades lower home prices for longer drives to work, fares better on crime within Missouri than nationally and trades workers with Kansas City and other neighbors.

OutdoorsB+

2% of the land in Richmond is protected from building

4.7 miles of trail in 5 parks and preserves. The biggest park or preserve is Southview Park, at 33 acres. In Richmond, the trail network density is 0.8 miles per square mile.

#36for trails in MO
RichmondMissouri townsU.S. towns
Miles of trail per square mile0.8 miles per square mile0.30.4
Conserved land2%2.1%4.3%
2%
conserved · 79 of 3,922 acres
4.7 mi
of trails · 0.8 per sq mi
Biggest places to walkTrailsAcres
1. Southview Park—33
2. Charles Armour Park—31
3. Maurice Roberts Park—12

Trails & parks © OpenStreetMap contributors · Conserved land: USGS PAD-US

SchoolsC−

Richmond earns a C− for schools

The public schools here belong to the Richmond R-Xvi school district. The largest public high school is Richmond High, with 474 students. Two of its 4 schools are shown below, with the reason for each.

22%of MO districts it outscoresC−School Grade
SchoolLevelStudentsLetter
Sunrise Elem.Largest public elementary schoolGrades 2–5Grades 2–5460C+
Richmond HighLargest public high schoolGrades 9–12Grades 9–12474C

NCES · EDFacts · graded within MO on state tests and graduation

HealthD

Richmond earns a D for health

20% of Richmond adults smoke cigarettes. Among adults locally, 36% get no exercise outside work.

10%healthier than U.S. townsDHealth Grade
RichmondMissouri townsU.S. towns
Get no exercise (CDC PLACES)36%30%25%
Smoke cigarettes (CDC PLACES)20%17%14%
Frequent physical distress (CDC PLACES)17%15%14%
High blood pressure (CDC PLACES)40%37%35%
32 measures vs. Missouri
0 better22 too close to call10 worse
What stands outRichmondMO
More older adults who have lost all their teeth21.5%15.8%
More adults with COPD10.6%8%
More smokers20.1%16%
Ray County Memorial Hospital
1.1 mi away · emergency room
3 of 3
care shortages: primary care, dental, mental health
23rd
percentile among MO towns

CDC PLACES 2025 · modeled estimates for adults · CMS · HRSA

Natural hazardsHazard risk grade B+

Natural hazards: low risk in Richmond, mostly inland flooding

In Richmond, the FEMA risk score is 27 of 100. 32% of the town’s expected losses from natural hazards come from inland flooding, followed by cold waves at 29%. The town has had 2 paid flood insurance claims since 1998.

27risk score of 100
FEMA risk score
27Low riskLowerHigher
Inland floodingCold wavesTornadoes
2
paid flood claims since 1998
6
federal disasters paid out here

FEMA flood insurance claims · FEMA National Risk Index · OpenFEMA

SafetyC

Richmond reports more crime per resident than 69% of U.S. towns

At 27.9 crimes per 1,000 residents a year, it reports more crime than 56% of Missouri’s graded towns. Reported crimes fell from 170 to 62 over the last three FBI years, a drop beyond ordinary year-to-year swings.

The rate of thefts and burglaries in Richmond is 17.7 per 1,000 residents. The level of violent crime locally is 3.2 per 1,000 residents.

31%of U.S. towns report more crimeCSafety Grade
RichmondMissouri townsU.S. towns
Violent crimes per 1,000 (2024)3.2 per 1,000 residents2.21.7
Property crimes per 1,000 (2024)17.7 per 1,000 residents13.811.5

Violent crime per 1,000 residents

Richmond3.2
Missouri4.7
U.S.3.6

Property crime per 1,000 residents

Richmond17.7
Missouri20.1
U.S.17.7
31st
percentile among U.S. towns we grade
44th
percentile among MO towns
19
violent crimes reported in 2024
105
property crimes reported in 2024

FBI crime data, 2024 · crimes reported to police

Climate

Four seasons and pleasant summers in Richmond

Summer afternoons peak near 88° in July, and January nights bottom out around 20°; snowfall runs to about 14 inches a winter. Summers in Richmond are warm, and winters chilly.

14″snow a winter

Typical low → high °F

Winter22–41°
Spring43–65°
Summer65–86°
Fall45–67°
Oct 25
typical first frost
Apr 8
typical last frost
+0.9°
vs. the 20th-century average

NOAA U.S. Climate Normals, 1991–2020

Work & commuteJobs & income grade C

About one in four working residents works right in Richmond

Richmond has about as many jobs (2,517) as working residents, but only 605 people both live and work here. The average commute takes 34.8 minutes, against 23.5 across Missouri.

Jobs based in Richmond grew to 2,517 in 2023, 392 more than in 2013. For working residents locally, the share who work locally is 23%. The top destinations are Kansas City (18%), Excelsior Springs (6%) and Liberty (6%). The middle household income for Richmond comes to $60,000.

23%work in town
RichmondMissouri townsU.S. towns
Working residents who work in town23%13%8%
Below the poverty line16%14%9.6%
Median household income$60,000$62,000$80,000

Where working residents work

In Richmond23%
Kansas City18%
Excelsior Springs6%
Liberty6%
Independence4%
26 mi
median commute distance
2,517
jobs based in Richmond
Balanced
jobs vs. working residents
A−
Walkability grade: more walkable than 78% of U.S. towns

Census LEHD 2023 · ACS

HousingCost of living grade A

Richmond earns an A for cost of living

Homes are within reach (about $236K for the typical one, A for cost of living), but half of working residents commute more than 26 miles.

Typical home values rose 2.7% in the year to September 2026. For Richmond, the midpoint rent is $722 a month. On the market here: a median 17 days to sell.

$236KZillow home value
RichmondMissouri townsU.S. towns
Households that own their home57%64%73%
Median rent$722 a month$972 a month$1,185 a month

Typical home value

Richmond$236K
Missouri$265K
Market temperature
BalancedA seller's marketBuyer’sSeller’s
17
days on market
+2.7%
value change, 1 year
12
homes sold in May

Census ACS, 2020–24 · Zillow Home Value Index · Redfin Data Center

Keep exploring

Everything we know about Richmond

19pages on Richmond
After high school

Colleges nearby

None within 15 miles of Richmond; the nearest are

Landmarks

4 places in Richmond on the National Register of Historic Places.

All landmarks →

About Richmond

City in Missouri, U.S.

Official town website ↗

Richmond is a city in and the county seat of Ray County, Missouri, United States, and is part of the Kansas City metropolitan area. The population was 6,013 at the 2020 census.

From Wikipedia, licensed CC BY-SA 4.0 · facts via Wikidata (CC0)

Established
1828
Area
6.1 sq mi
Elevation
823 ft
ZIP code
64085
Area code
816

Richmond’s neighbors

One town shares a border with Richmond.

Explore the map →
HenriettaHenriettaRichmond
How the neighbors grade
TownMO rankOverallCostSafetySchoolsHealth
Richmond#163CACC−D
Henrietta——————

Henrietta isn’t graded (fewer than 1,000 residents, or not enough data). Compare Richmond with a neighbor →

Questions about Richmond

Short answers, built from the data on this page.

Is Richmond, MO a good place to live?

Richmond grades C overall, better than 28% of U.S. towns and #163 of 247 in Missouri. It grades D for health, C for safety and C− for schools. Health is its weak spot, with a D.

Is Richmond, MO expensive?

Not for the area. Cost of living, which also weighs rents, property taxes and how many households pay 30% or more of their income for housing, grades A.