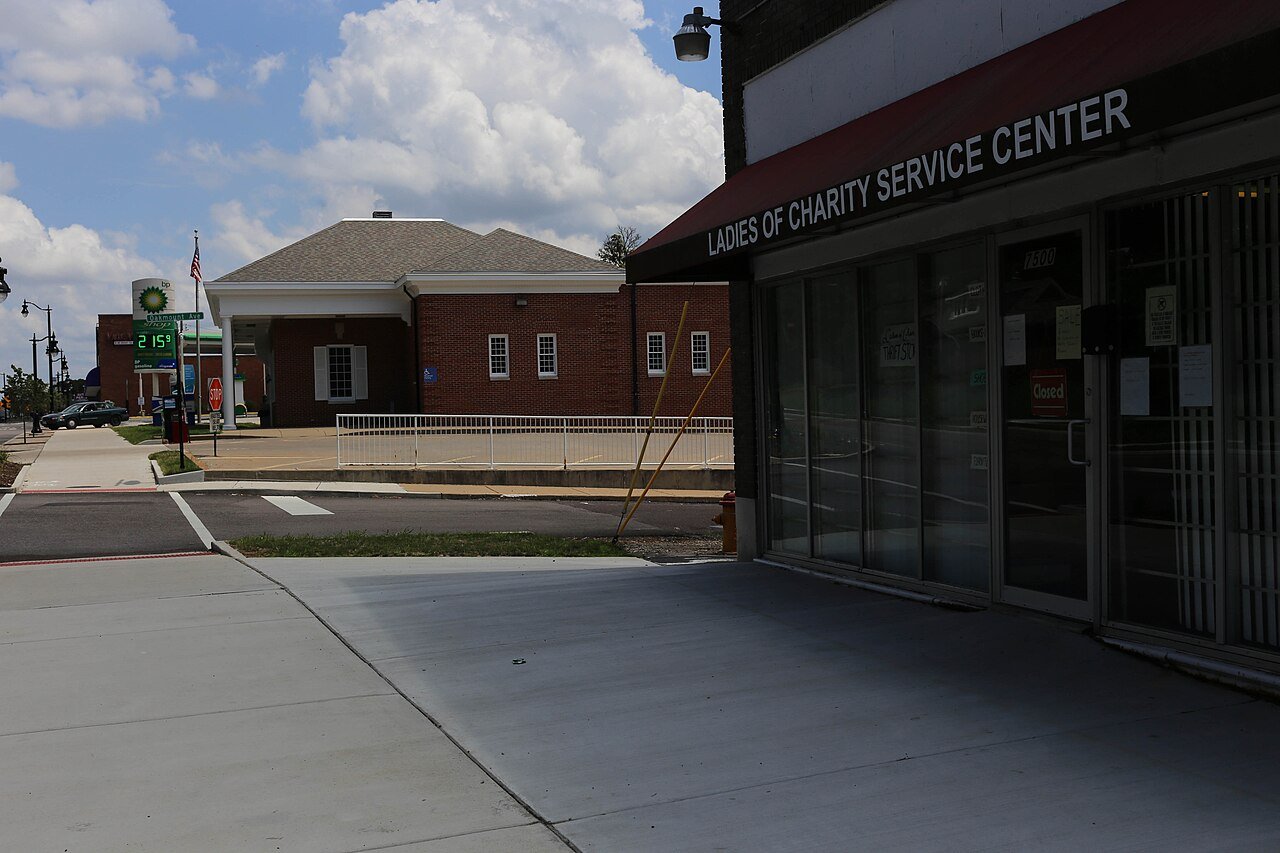
 Photo: Paul Sableman · CC BY 2.0
How is Bel-Ridge run?
Bel-Ridge’s village government spent $1.3 million on day-to-day services in the year to December 31, 2022, about $495 per resident. These are Census Bureau estimates: Bel-Ridge didn’t report its figures, so this page shows them without comparisons.
What stands out about how Bel-Ridge is run
Read from the village’s budget and official records.
Normandy Schools Collaborative
Bel-Ridge’s K–12 school district, shared with Bel-Nor, Bellerive Acres, Beverly Hills, Greendale, Hanley Hills and more. It’s its own government, with a budget separate from the town’s.
Of the $16,947 per pupil, $6,642 goes to the classroom (teachers, aides, supplies); the rest to buses, buildings, counselors and administration. Building projects and debt payments aren’t in the per-pupil figure.
Missouri districts overall: 54% local, 35% state, 11% federal.
School year 2023–24. Census Bureau school finance survey.
About $495 per resident a year, or $1.36 a day
Day-to-day services only (a Census Bureau estimate). The biggest line: administration & buildings, at 69%.
Thank you for being a neighbor
Bel-Ridge didn’t report all of its 2022 figures to the Census Bureau, so most of these numbers are the Bureau’s estimates.
No comparison or trend for Bel-Ridge yet
Every year of Bel-Ridge’s figures is a Census Bureau estimate: the village reported none of its dollars for 2022. Estimates are shown above, labeled, but never ranked against places that reported or drawn as a trend.
How Town Hall compares budgets →The typical homeowner pays $1,498 a year
Every local property tax on the home: town, schools and county. About 1.65% of the home’s value, vs 0.85% across Missouri.
Typical yearly bill next door and statewide
The Housing page’s calculator splits a monthly payment into loan, tax and insurance at Bel-Ridge’s rate.
Can I afford it? →The median bill homeowners report to the Census survey (bills of $10,000+ are reported as “$10,000+”). The effective rate is that bill ÷ the median home value: a rough guide, not the official tax rate. In a town this small the estimate has a wide margin.
Tax bills are one input to Bel-Ridge’s Cost of living grade. Cost of living in Bel-Ridge →
Who’s in charge in Bel-Ridge
Names change after every election, so we link to the source that keeps them current.
Bel-Ridge’s meeting calendar isn’t in our feed yet. The village posts agendas and minutes on bel-ridge.us ↗.
One full-time village employee for every 534 residents
On the payroll in March 2022, from the Census Bureau’s Annual Survey of Public Employment & Payroll. Residents: the Census population in the 2022 finance file (2,668).
By department full-time, plus part-time, March 2022
The Census reports one month’s payroll (March); yearly figures are that month × 12, an estimate. Part-timers count half in the bar lengths.
Bel-Ridge’s votes are counted by county
Missouri reports official results by county and precinct, not by village, so there are no official results for Bel-Ridge alone, and we don’t estimate them. These are St. Louis County’s results.
 Kamala D HarrisDemocrat60.8%305,635 votes
 Donald J TrumpRepublican37.4%187,982 votes
Others: 1.8% (9,121 votes).
Most votes in St. Louis County: Kamala D Harris
Missouri: Trump 58.5%, Harris 40.1%
100% of Bel-Ridge lies in St. Louis County. Every 2024 race in St. Louis County is on the county’s page.
St. Louis County’s 2024 results →Official 2024 general election returns, as certified (MIT Election Data + Science Lab). Percentages are of votes for candidates; blank and spoiled ballots aren’t counted. Candidates are listed by votes, and party colors are neutral on purpose.
Portraits: Kamala D Harris: official vice-presidential portrait, Lawrence Jackson, The White House, 2021; Donald J Trump: official portrait, Shealah Craighead, The White House, 2017. All are U.S. government works in the public domain. A race shows photos only when every candidate has an official portrait; otherwise every candidate in it gets initials.
From town hall to Washington
Every level of government that speaks for Bel-Ridge.
- 1Your cityMayor & councilOfficials: bel-ridge.us ↗
- 2Missouri HouseState representatives
- 3Missouri SenateState senator
- 4GovernorStatewide
- 5U.S. HouseYour representative in Congress
- 6U.S. SenateBoth represent all of Missouri
Democrat · Republican · other or independent. Tap a name for their official page.
How Bel-Ridge compares with the towns next door
Bel-Ridge’s own figures are Census estimates, so it isn’t placed among its neighbors. 2 of the 3 towns next door reported 2022 figures, from $452 to $1,256 per resident. Tap a town to see its page.
Day-to-day spending in 2022, the last year every government was counted, for governments that reported it; hospital and utilities left out. Tax bill: the typical homeowner’s bill (Census ACS, 2020–24).
Reach Bel-Ridge’s government
The official site has phone numbers, hours and forms. Neighbors add the rest to the Handbook.
Questions about Bel-Ridge’s government
How much does Bel-Ridge spend per resident?
About $495 per resident on day-to-day services in the year to December 31, 2022, a Census Bureau estimate (Bel-Ridge didn’t report its figures). With building projects and interest, the whole budget was about $1.4 million.
What is the property tax rate in Bel-Ridge?
Homeowners report a typical bill of $1,498 a year (Census ACS, 2020–24), about 1.65% of the typical home’s value, vs 0.85% across Missouri. For the official rate per $1,000 of assessed value, see bel-ridge.us.
Who runs Bel-Ridge’s government?
See bel-ridge.us for current officials. We name an official only when a public source lists a current term, and none does for Bel-Ridge yet.
How did Bel-Ridge vote in 2024?
Missouri counts votes by county and precinct, not by village, so there are no official results for Bel-Ridge alone. St. Louis County, where 100% of Bel-Ridge lies, voted Harris 60.8%, Trump 37.4% for president; its page has every race.
How many people work for Bel-Ridge?
5 full-time and 15 part-time employees in March 2022, with a March payroll of $29,153 (about $349,836 a year if every month were the same), as reported to the Census Bureau.
Who represents Bel-Ridge in the state legislature?
State Senate District 14 (Brian Williams) and State House District 74 (Marla Smith). The House district also covers 20 other towns. Listed by Open States; districts from the Census Bureau.
Ask neighbors about Bel-Ridge’s government
Neighbors who’ve been to the meetings can help.
Budget and staff: U.S. Census Bureau, Census of Governments (2022, every government) and Annual Survey of State and Local Government Finances (2023–24, a sample) and the Annual Survey of Public Employment & Payroll (for Bel-Ridge, the Bureau’s estimates); day-to-day spending is current operations, with hospitals, utilities and airports apart. School district: Census school finance survey, 2023–24. Property tax: Census American Community Survey, 2020–24. Elections: official 2024 returns via the MIT Election Data + Science Lab; turnout uses Census citizen voting-age population (CVAP, 2020–24). Officials: Open States, names shown only with a current term (checked October 9, 2026). Districts: Census Bureau (119th Congress, 2024 state districts); legislators: Open States and congress-legislators. How Town Hall works →