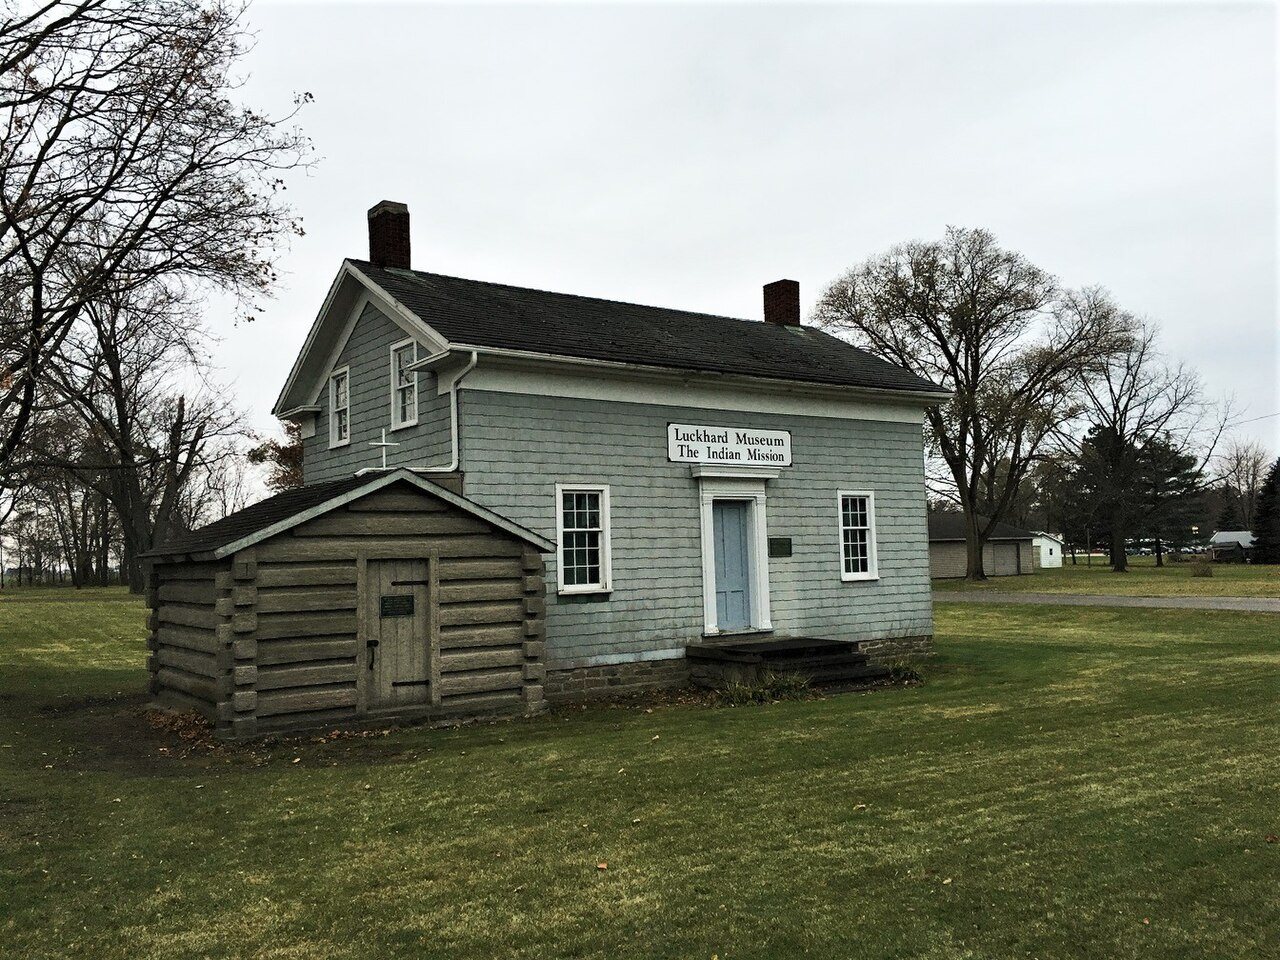
 Indian Mission · Photo: Jon Roanhaus · CC BY-SA 4.0
Measured against area pay, Sebewaing Township costs less to live in than 79% of U.S. towns
It ranks #76 of 701 in Michigan for affordability. Home prices around Sebewaing Township have risen about 78% over the past 5 years.
Census 2020–24 home values, rents, tax bills and cost burden, measured against the median household income of Huron County, MI ($59K). How TownRatings grades cost of living
The grade compares costs with what households across Huron County earn ($59K, Census 2020–24). The typical home costs 1.9 years of area income, and 23% of renters pay 30% or more of income for housing.
In dollars
- $1,210a month for a two-bedroom, utilities includedHUD Fair Market Rent, 2026
In paychecks the grade
- 1.9 yrsof area income buys the typical home; the typical U.S. town: 3.3$59K, Huron County income
- 18%of area income goes to the median rent; the typical U.S. town: 18%Census 2020–24
- 23%of renters pay 30%+ of income for housing; across Michigan: 50%Census 2020–24
- 15%of owners do; the typical U.S. town: 20%Census 2020–24
Housing in Sebewaing Township, in brief
Prices rose faster than Michigan’s over five years
There’s no Zillow index for Sebewaing Township, so the page uses the federal house price index for the ZIP codes around it, which follows repeat sales of the same homes. It rose 78% over five years, against 52% across Michigan. Price trend ↓
Owning can cost less than renting
With 20% down at the calculator’s rate, the typical Sebewaing Township home runs about $1,040 a month with tax and insurance. A two-bedroom rents for about $1,210. Can I afford it? ↓
Written from the data on this page. There’s no Zillow index for Sebewaing Township, so the typical value is an estimate: the Census median carried forward with the federal house price index; incomes, rents paid, taxes and ownership come from the Census American Community Survey.
What’s behind Sebewaing Township’s grade
Measured against what households in the area earn, Sebewaing Township is more affordable than 79% of U.S. towns, #76 of 701 in Michigan. Rent pulls the grade down most; home prices hold it up.
Home prices up 78% in 5 years
The federal house price index for the ZIP codes around Sebewaing Township rose 78% over the past 5 years, faster than across Michigan (52%). Last year prices rose 4.4%. Carrying the Census median home value forward with that index puts the typical Sebewaing Township home at roughly $158,000 today.
Carrying the Census median forward with the index puts a typical home at about $158K.
Federal Housing Finance Agency House Price Index (annual) for the ZIP codes around Sebewaing Township, weighted by land area. It tracks repeat sales of the same homes, so it shows how prices changed, not what homes cost.
A typical home costs 1.9 years of area income
The calculator starts from the area income the grade uses. Switch to Sebewaing Township’s own median, or type yours.
That covers a typical Sebewaing Township home, with $52K to spare.
A two-bedroom rents for about $1,210 a month here, $170 more than owning.
An estimate, not a loan offer: payments of up to 28% of income, a 30-year fixed loan, Sebewaing Township’s typical property tax (1.55% of value a year, from the Census) and insurance of about 0.35%. Mortgage insurance, HOA fees and other debts aren’t included.
A two-bedroom rents for about $1,210
Renters already here pay a median of $904, so moving in tends to cost more than staying put.
Fair Market Rent a month, utilities included
U.S. Department of Housing and Urban Development, Fair Market Rents by ZIP code (Huron County, MI): the 40th-percentile rent plus utilities for a standard unit. Median rent and renters: U.S. Census Bureau, American Community Survey.
Low tax bills, but a high tax rate
The median bill is $1,732, under the Michigan median of $2,904, because homes cost less. As a share of value it’s 1.55% a year, against 1.25% statewide.
Census American Community Survey 2020–24: the median real-estate tax bill homeowners report, and that bill ÷ the median home value. Bills include town, school and county taxes. The Census reports bills over $10,000 only as “$10,000+”.
The rest of a budget near Sebewaing Township
Only figures published free for the whole country, each labeled with the area it covers: Michigan, or Michigan. Groceries follow the goods price level; nobody publishes them town by town.
| Cost | Here | Compared with | Area | Source |
|---|---|---|---|---|
| Electricity cents per kWh, homes | 23.1¢ | U.S. 18.3¢ | state | EIA, July 2026 |
Price levels: U.S. Bureau of Economic Analysis, Regional Price Parities 2024 (metro area and state). Electricity: U.S. Energy Information Administration, Electric Power Monthly, table 5.6.A.
Sebewaing Township vs. its neighbors
Zillow publishes no value for Sebewaing Township. Fairhaven Township and Columbia Township and Brookfield Township have no Zillow value, so they are in the table only.
Cost next door · one source per column
| Town | Cost | Typical home Zillow, latest | Median value Census 2020–24 | Tax rate bill ÷ value | 2-bed rent HUD 2026 |
|---|---|---|---|---|---|
| Sebewaing Township | A− | — | $111K | 1.55% | $1,210 |
| Fairhaven Township | B+ | — | $132K | 1.11% | $1,050 |
| Brookfield Township | – | — | $113K | 1.33% | $1,050 |
| Akron Township | A | $128K | $112K | 1.38% | $1,080 |
| Columbia Township | A | — | $130K | 1.40% | $1,120 |
“—” under Zillow: Zillow publishes no value for that town, so it’s left blank rather than mixed with Census figures. “—” under Cost: not graded (too little Census data, or under 1,000 residents).
Questions about the cost of living in Sebewaing Township
Is Sebewaing Township expensive to live in?
Measured against what households in the area earn, Sebewaing Township costs less than 79% of U.S. towns: an A− for cost of living, #76 of 701 in Michigan. The typical home costs 1.9 years of the median household income of Huron County, MI ($59K).
How much is rent in Sebewaing Township?
HUD puts a two-bedroom at about $1,210 a month with utilities, the going rate for someone moving in. Renters already here pay a median of $904 (Census 2020–24).
What are property taxes in Sebewaing Township?
The median bill is $1,732 a year, 1.55% of the median home value (Michigan: $2,904, 1.25%), from the Census 2020–24.
Neighbors talk housing
What Sebewaing Township buyers, sellers and renters are saying.
Home values: Zillow Home Value Index (ZHVI), Zillow Research. Sales, days on market and supply: Redfin Data Center. Income, ownership, taxes and rent: U.S. Census Bureau, American Community Survey. Price trend: Federal Housing Finance Agency House Price Index. Fair Market Rents: U.S. Department of Housing and Urban Development. The calculator is an estimate, not a loan offer. Regional price levels: BEA; electricity: EIA. How TownRatings grades cost of living.