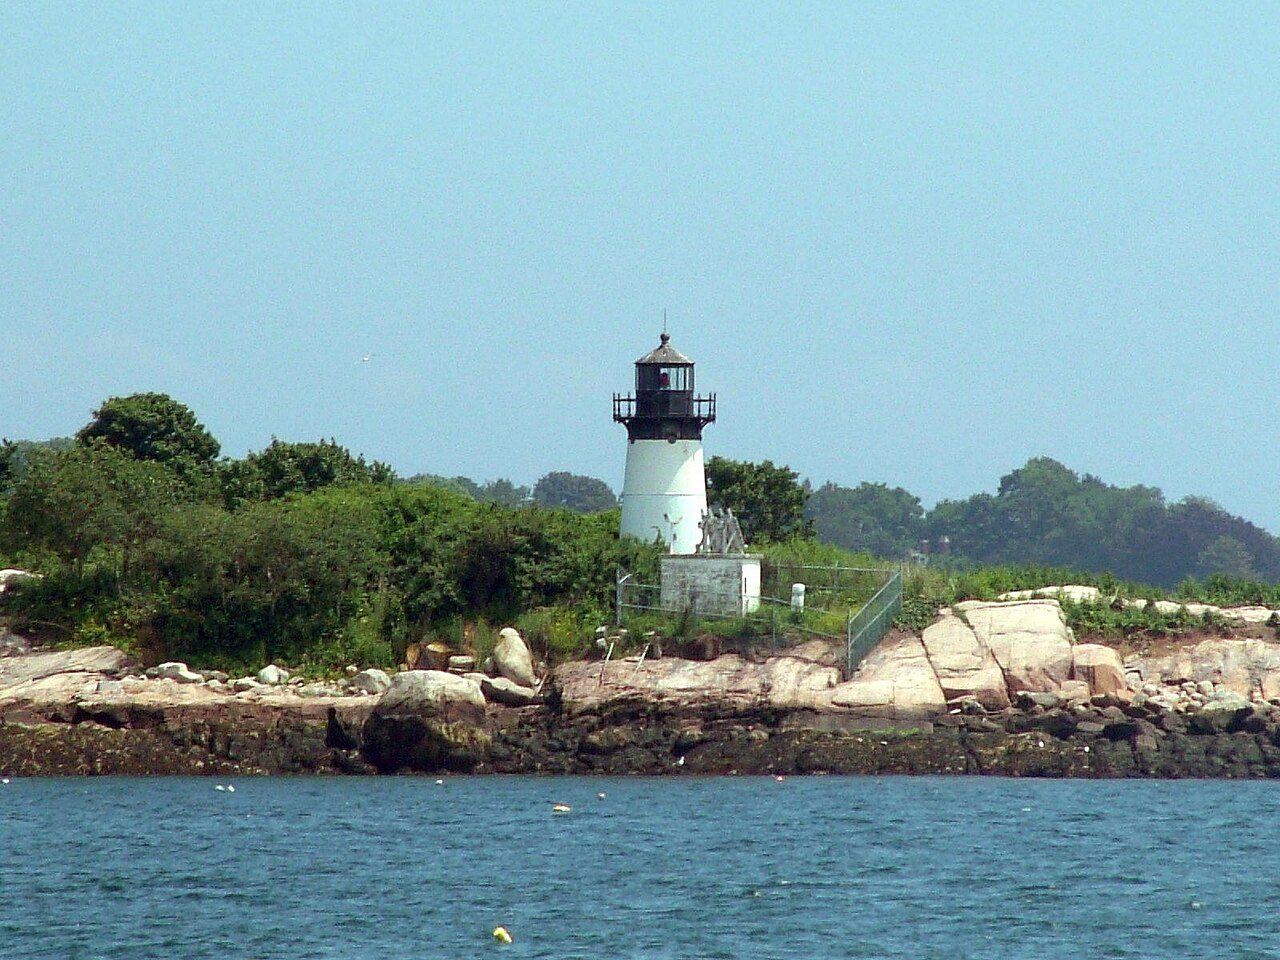
 Ten Pound Island Light · Photo: Unitzebra3 at en.wikipedia · Public domain
Afternoon heat in Manchester-by-the-Sea trails that of 92% of U.S. towns
Midwinter brings lows of about 20°. By precipitation alone, it ranks wetter than 76% of U.S. towns. Since 1901–2000, the year has warmed by 1.8°, most of all in December. The frost-free window for a garden runs roughly April 25 to October 20.
A year in Manchester-by-the-Sea at a glance
Each month’s typical high and low, and what it brings.
What stands out about Manchester-by-the-Sea’s climate
Compared with towns across the U.S., with Manchester-by-the-Sea’s place in Massachusetts beside it.
What a year in Manchester-by-the-Sea feels like
Typical highs and lows by season and by month, from NOAA’s 30-year normals.
About 176 frost-free days a year
In half of years the last 32° night comes by April 25 and the first by October 20. Frost and day counts come from NOAA’s station at Marblehead, MA, 6 miles from the town’s center, at about the same height.
The 2023 USDA map puts Manchester-by-the-Sea’s center in zone 7a: the coldest night of a typical winter, averaged over 1991–2020, reaches about 1°. Plant labels use the zone; frost dates tell you when to plant.
Freezing nights by month
Average nights at or below 32°
90° days by month
Average days at 90° or more
About 39 inches of snow a winter
Snow, measured at Marblehead, MA, falls mostly in January. Precipitation (rain plus melted snow) adds up to 48 inches a year; October is the wettest month and July the driest. Rain or snow falls on about 115 days a year.
Rain + melted snow by month
Inches of water
Snowfall by month
Inches of snow
Heating and cooling a home in Manchester-by-the-Sea
93% of the work is heating, so the furnace matters far more than the air conditioner. Months averaging under 55° run from October through April.
Degree days add up how far each day’s average falls below (heating) or rises above (cooling) 65° over a year. NOAA normals at Marblehead, MA.
Living with Manchester-by-the-Sea’s climate
What the numbers mean for a garden, a free afternoon and a bad-weather day.
176 frost-free days in zone 7a. The last frost comes by Apr 25 in half of years, so many gardeners wait a week or two past that to set out tomatoes. The first fall frost comes by Oct 20.
Months with highs of 62–84° and lows of 40° or more: May, June, July, August and September. 43 miles of trails are waiting.
Parks & trails →Of the yearly building losses FEMA expects in Manchester-by-the-Sea from natural hazards, river flooding is the largest share (57%); heat waves, cold waves, winter storms and ice storms together are 4%. Normals are averages; the hazards page covers the extremes.
Natural hazards →Manchester-by-the-Sea and its neighbors
Hamilton has the coldest January nights next door (19°, 2° colder) and Wenham the hottest July afternoons (81°, 1° warmer). Differences under a degree are within what the 5 km grid can tell apart. Tap a town to see its climate.
Climates most like Manchester-by-the-Sea’s, farther away
TownRatings’ own comparison of NOAA 1991–2020 normals, not a NOAA product: places of 5,000+ at least 150 miles away, one per state, closest on January low, July high, precipitation and snow.
| Town | Jan. low | July high | Precip. | Snow |
|---|---|---|---|---|
| Manchester-by-the-Sea, MA | 20° | 80° | 48" | 39" |
| Mount Carmel, PA | 18° | 80° | 49" | 48" |
| Woodbury, NY | 18° | 81° | 50" | 36" |
| Lake Hopatcong, NJ | 18° | 82° | 50" | 28" |
| Bluefield, WV | 23° | 81° | 42" | 40" |
Temperatures and rain come from NOAA’s 5 km grid, so each town gets its own value. Snow and frost-free days come from the nearest weather station, so neighbors often share them.
Warmer than it used to be
The last 30 years in Manchester-by-the-Sea averaged 1.8° warmer than the 1900s. The biggest change is in December (+3.3°).
A bigger shift than in 77% of U.S. towns.
Change by month
The two periods overlap (1991–2000 is in both), which makes the gap a little smaller than it would be between separate periods.
How Manchester-by-the-Sea compares
Against 12,954 U.S. towns of 2,500 or more (one per 5 km climate cell), with Manchester-by-the-Sea’s place among Massachusetts’.
Manchester-by-the-Sea weather by month
Highs, lows and precipitation from NOAA’s grid at Manchester-by-the-Sea’s center; snow, wet days and snow on the ground from Marblehead, MA. 1991–2020 normals.
| Month | High | Low | Rain + melt | Snow | Wet days | Snow on ground | 30-yr range |
|---|---|---|---|---|---|---|---|
| January | 36° | 20° | 3.7" | 13.3" | 10 | 13 | 19° – 36° |
| February | 38° | 22° | 3.5" | 8.5" | 9 | 11 | 17° – 36° |
| March | 45° | 28° | 4.6" | 7.5" | 10 | 8 | 31° – 45° |
| April | 56° | 38° | 4.3" | 1.5" | 11 | 1 | 43° – 51° |
| May | 65° | 47° | 3.6" | 0.0" | 11 | 0 | 51° – 61° |
| June | 74° | 57° | 4.1" | 0.0" | 10 | 0 | 62° – 68° |
| July | 80° | 63° | 3.4" | 0.0" | 9 | 0 | 67° – 74° |
| August | 79° | 61° | 3.5" | 0.0" | 8 | 0 | 67° – 73° |
| September | 72° | 55° | 3.7" | 0.0" | 8 | 0 | 60° – 67° |
| October | 61° | 44° | 4.9" | 0.1" | 10 | 0 | 49° – 59° |
| November | 51° | 35° | 4.0" | 0.8" | 10 | 0 | 37° – 47° |
| December | 42° | 26° | 4.8" | 7.4" | 10 | 6 | 27° – 44° |
| Year | 58° | 41° | 48.1" | 39.1" | 115 | 39 |
How much a month can swing
A normal is an average. February swings the most: from 1991 to 2020 its average ranged from 17° to 36°. August is the most reliable, staying within 6°.
Where Manchester-by-the-Sea’s numbers come from
Normals are 30-year averages, not a forecast. How TownRatings reads climate data →
- Temperatures and precipitation: NOAA’s gridded 1991–2020 normals for the 5 km cell at Manchester-by-the-Sea’s center.
- Snow: Marblehead, MA.
- Frost, freezing nights, 90° and 100° days, heating and cooling: Marblehead, MA, 6 miles from the town’s center, at about the same height; the nearest station that passes our checks for distance, height and agreement with the grid.
- Growing zone: USDA Plant Hardiness Zone Map, 2023. USDA Agricultural Research Service and PRISM Group, Oregon State University, prism.oregonstate.edu/phzm, accessed 8 Oct 2026.
- Then and now: NOAA’s gridded normals for 1901–2000 at the same cell.
- Storms and extremes: FEMA National Risk Index (expected annual losses to buildings).
Common questions about Manchester-by-the-Sea’s climate
What is the weather like in Manchester-by-the-Sea?
A typical July afternoon reaches 80°, a January night drops to 20°, and about 39 inches of snow falls in a normal winter. Colder January nights than 58% of U.S. towns; cooler July afternoons than 92% of U.S. towns.
How cold does it get in Manchester-by-the-Sea in winter?
January nights average 20°. About 108 nights a year reach 32° or below and 2 reach 0° or below. In the coldest January of the last 30 years the month averaged 19°.
How much snow does Manchester-by-the-Sea get?
About 39 inches in a normal winter at Marblehead, MA, most of it in January, with snow on the ground about 39 days a year.
How hot does it get in Manchester-by-the-Sea?
July, with a typical high of 80° and a low of 63°. About 9 days a year reach 90° (Marblehead, MA).
When is the first and last frost in Manchester-by-the-Sea?
In half of years the last spring frost (32°) comes by April 25 and the first fall frost by October 20, about 176 frost-free days, at Marblehead, MA.
What growing zone is Manchester-by-the-Sea in?
Zone 7a on the 2023 USDA Plant Hardiness Zone Map: the coldest night of a typical winter reaches about 1°.
What is the best time of year to visit Manchester-by-the-Sea?
By one simple rule (highs of 62–84° and lows of 40° or more), May, June, July, August and September. The rule is ours, not NOAA’s; the month table has the numbers to judge by.
Is Manchester-by-the-Sea getting warmer?
Yes: 1991–2020 averaged 1.8° warmer than 1901–2000 on NOAA’s grid. A bigger shift than 77% of U.S. towns.
Neighbors talk weather
Gardens, snow, and the best days of the year in Manchester-by-the-Sea.
Source: NOAA NCEI U.S. Climate Normals, 1991–2020 and 1901–2000; USDA/PRISM 2023 hardiness zones; FEMA National Risk Index. Today’s forecast: National Weather Service.