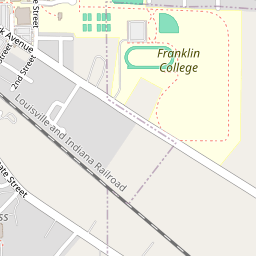
Franklin College
Franklin College is a private nonprofit college in Franklin, IN, with about 966 students on campus.




How hard is it to get into Franklin College?
of applicants admitted
About 14 of every 20 applicants get in.
Test scores of admitted students
The middle 50%: a quarter scored below the range and a quarter above it. Average SAT: 1145.
The sticker price, and what families really pay
Sticker price: $54,178 a year
Before any grants
After grants, the average family on aid pays $22,855.
Your family’s price
Average net price after grants, by family income
About $80,372 over 4 years · 63% off the sticker price
Do students finish, and does it pay off?
Debt vs. the paycheck
The typical loan payment as a share of a typical graduate’s monthly pay six years after starting
$286 a month against about $3,803 a month in pay.
Paying back loans
Federal student loans, this college
of borrowers paid down at least some of their loan within three years, more than at 88% of U.S. colleges.
Almost none defaulted within three years (payments on federal loans were paused from 2020 to 2023, so recent default rates are near zero everywhere).
Earnings by family background
Median earnings 10 years after starting, by family income at enrollment
What students study, and what it pays
Share of degrees by field
Bachelor’s programs with the most graduates
And their graduates’ median earnings four years later (one year where that’s all that’s reported).
The students
900 degree-seeking undergraduates.
By race and ethnicity
Women and men
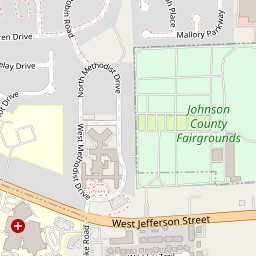
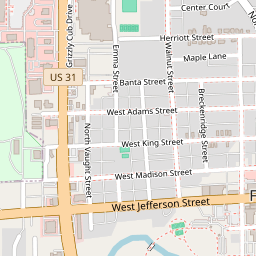
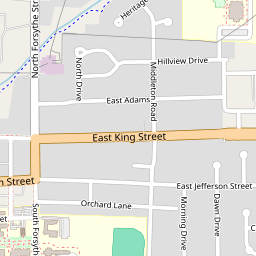
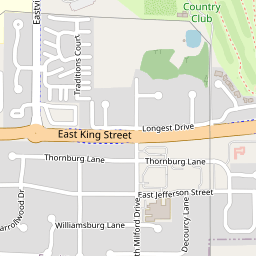
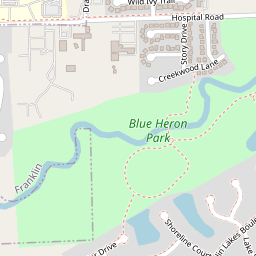
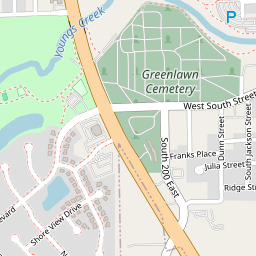
Living in Franklin
8% of Franklin’s 26,743 residents are enrolled in college. What the town is like, from TownRatings’ Franklin pages.

Other colleges within 30 miles
Straight-line distances from Franklin College; colleges with 100 or more students on campus.
Ask around
Students, parents, alumni and the neighbors next door.
Sources: U.S. Department of Education College Scorecard (institution and field-of-study files) and IPEDS (Scorecard 06/10/2026 · IPEDS 2024 · fall 2023); town figures from the Census American Community Survey and NOAA climate normals. Graduation rates count first-time, full-time students; earnings and debt are for students who received federal aid. Distances are straight-line. Colleges are described, not graded (how TownRatings describes colleges). Map © OpenStreetMap contributors.