
Illinois Central E9A 4034, 1962
Richton Park’s story
98 years in pictures
Census counts: 137 in 1930, 12,775 in 2020. The archive holds 8 old photos and papers going back to 1962 and 5 maps from 1930 on.
- 1928Richton Park is settled
Each edition grades its towns against each other only.
Richton Park is a solid, middle-of-the-road choice. It grades C− overall, ranked 674th of 767 in Illinois, with no subject far below average. Its best mark is health: it is healthier than 60% of U.S. towns. Expect to pay for it: homes are expensive, about $228K for a typical one and 2.5 times the Chicago metro’s $91K median household income. On history, just 31 of Illinois’ 1,285 towns do worse. Richton Park is more walkable than 81% of U.S. towns. The biggest park or preserve is Glaeser Park, at 30 acres.
Where Richton Park beats most towns.
Where Richton Park’s working residents go each day. Line width shows the share.
Census LEHD 2023
Each subject compared with towns across the country (schools within Illinois), ordered by how far Richton Park is from typical.
How TownRatings grades towns →
Census counts: 137 in 1930, 12,775 in 2020. The archive holds 8 old photos and papers going back to 1962 and 5 maps from 1930 on.
Museums, parks, gardens and other places to visit around Richton Park. Close and well known come first.
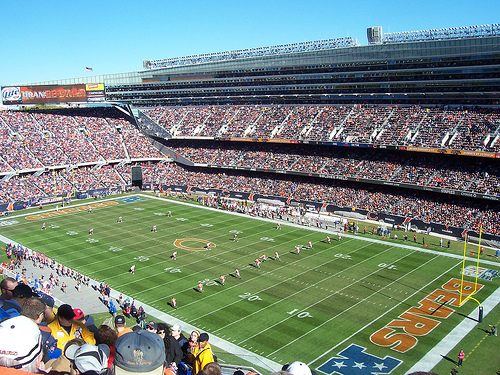 Big draw27 mi Stadium & arenaSoldier Field
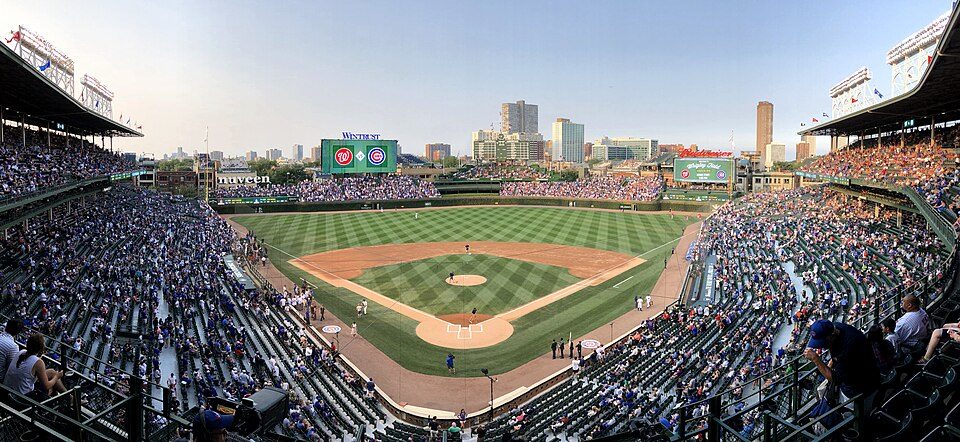 Big draw33 mi Stadium & arenaWrigley Field
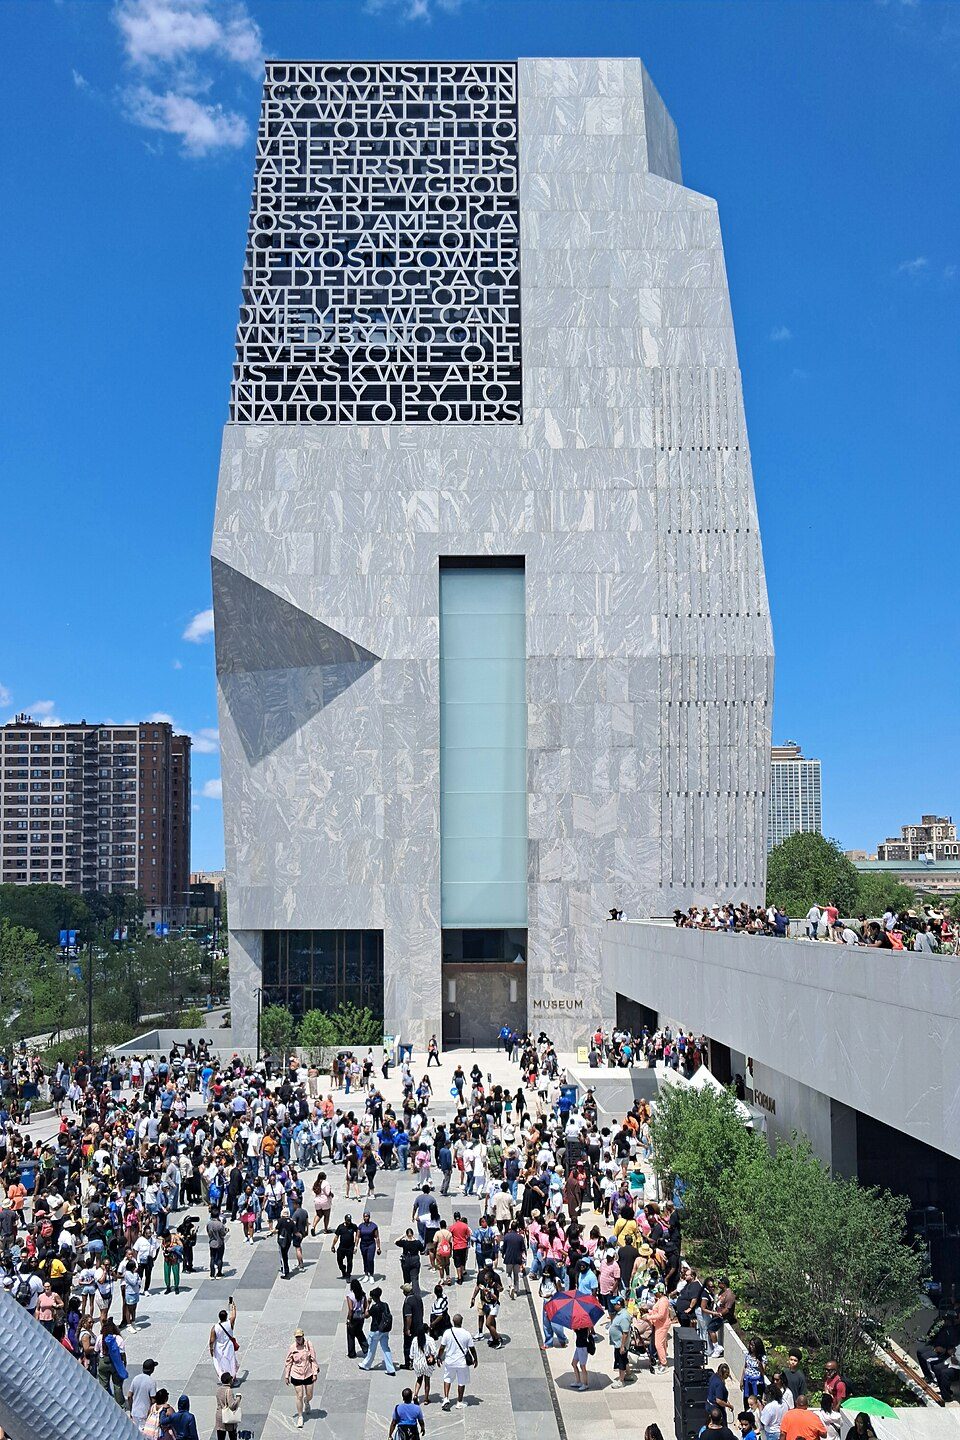 Big draw23 mi MuseumBarack Obama Presidential Center
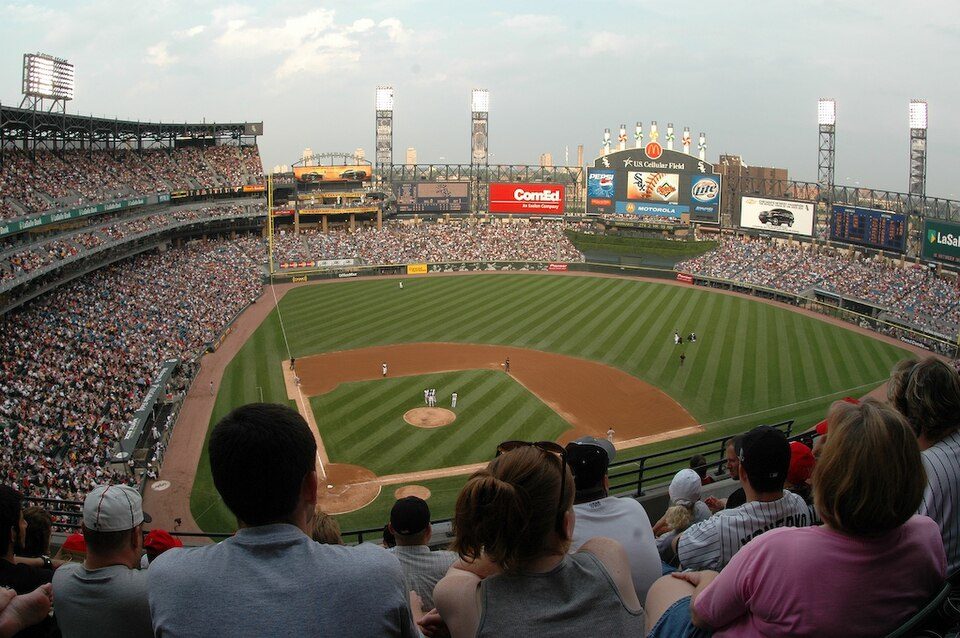 Big draw25 mi Stadium & arenaRate Field
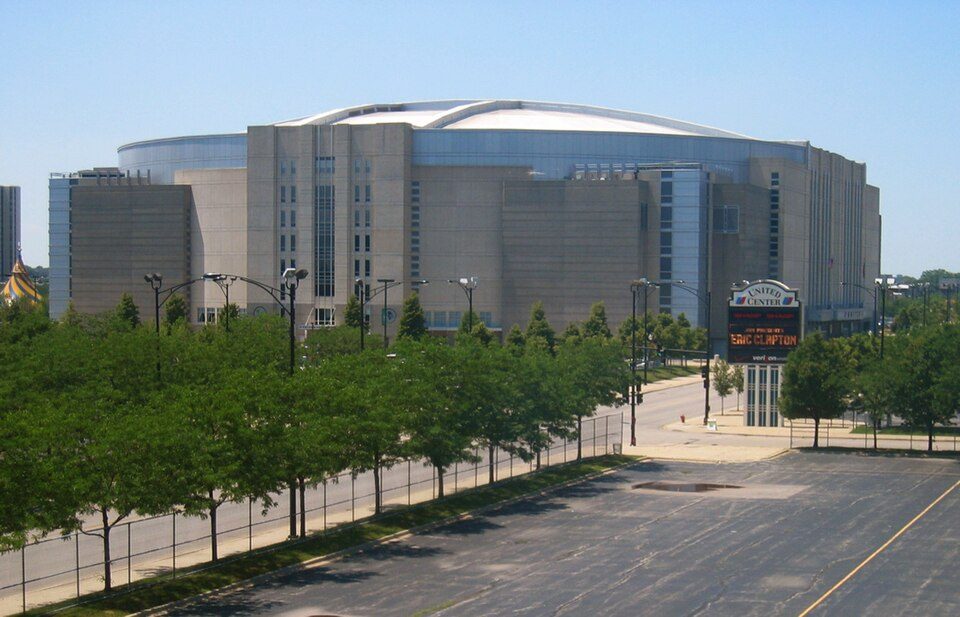 Big draw28 mi Stadium & arenaUnited Center
 Big draw28 mi MuseumArt Institute of Chicago1.5M visitors a year
Soldier Field: Photo by Joon Han Contact: [email protected], CC BY-SA 3.0 · Wrigley Field: Ryan Dickey, CC BY 2.0 · Barack Obama Presidential Center: AlphaBeta135, CC0 · Rate Field: User Enoch Lai on en.wikipedia, CC BY-SA 3.0 · United Center: User:JeremyA, CC BY-SA 2.5 · Art Institute of Chicago: ajay_suresh, CC BY 2.0
Who provides power, water and the rest in Richton Park, and how to reach them.
EPA SDWIS (Oct 9, 2026) · HIFLD + EIA-861 2025 · Census 2020 ZCTAs · NCES 2024–25 · registration: vote.gov, updated Sep 12, 2025.
Ordered by what stands out in Richton Park.
Richton Park is healthier than towns with similar incomes and sends most of its workers to Chicago and beyond, but it reports more crime than University Park and its other graded neighbors.
1.6 miles of trail in 5 parks and preserves.
| Richton Park | Illinois towns | U.S. towns | |
|---|---|---|---|
| Conserved land | 3.2% | 3.7% | 4.3% |
| Miles of trail per square mile | 0.4 miles per square mile | 0.3 | 0.4 |
| Biggest places to walk | Trails | Acres |
|---|---|---|
| 1. Glaeser Park | 0.4 mi | 30 |
| 2. Klawitter Park | 0.4 mi | 16 |
| 3. Pierce Park | — | 12 |
Trails & parks © OpenStreetMap contributors · Conserved land: USGS PAD-US
Richton Park has 1,362 jobs for its 4,829 working residents: even if every job went to a resident, most would still commute out. Jobs based here fell from 2,161 in 2013 to 1,362.
Most working residents leave Richton Park for work: only 2% work in town. At 33 minutes, Richton Park’s average trip to work is where Illinois’ towns sit at 26 minutes and U.S. towns at 25 minutes. Since 2013, Richton Park has lost 799 jobs, to 1,362 in 2023.
| Richton Park | Illinois towns | U.S. towns | |
|---|---|---|---|
| Average trip to work | 33 minutes | 26 minutes | 25 minutes |
| Working residents who work in town | 2.4% | 8.4% | 8% |
| Median household income | $65,000 | $83,000 | $80,000 |
| Work from home | 13% | 11% | 11% |
Census LEHD 2023 · ACS
Each of the 3 graded towns on its borders reports less crime per resident, from University Park (C) to Frankfort (A−).
At 18.2 per 1,000 residents, Richton Park’s property crime rate is above both Illinois’ towns (7.9) and U.S. towns (9.9). The violent crime rate in Richton Park is 3 per 1,000 residents.
| Richton Park | Illinois towns | U.S. towns | |
|---|---|---|---|
| Property crimes per 1,000 (2025) | 18.2 per 1,000 residents | 7.9 | 9.9 |
| Violent crimes per 1,000 (2025) | 3 per 1,000 residents | 1 | 1.6 |
FBI crime data, 2025 · crimes reported to police
60.3% of renter households pay 30% or more of their income for housing, against 47.9% across Illinois.
52% of Richton Park households own their home. Typical home values rose 7.5% in the year to September 2026.
| Richton Park | Illinois towns | U.S. towns | |
|---|---|---|---|
| Households that own their home | 52% | 75% | 73% |
| Median rent | $1,294 a month | $1,128 a month | $1,185 a month |
Census ACS, 2020–24 · Zillow Home Value Index · Redfin Data Center
Richton Park has chilly winters and pleasant summers. July afternoons reach 84°, January nights drop to 16° and about 28 inches of snow falls in a winter.
NOAA U.S. Climate Normals, 1991–2020
Against the 9,841 U.S. towns with household incomes like Richton Park’s, it is healthier than 82%, so its B isn’t only a matter of income.
17% of adults have been diagnosed with depression in Richton Park. Richton Park beats the Illinois average on 10 of 32 CDC measures and trails it on 12. 14% of adults have diabetes in Richton Park.
| Richton Park | Illinois towns | U.S. towns | |
|---|---|---|---|
| Sleep under 7 hours (CDC PLACES) | 44% | 35% | 36% |
| Depression (CDC PLACES) | 17% | 22% | 23% |
| Feel lonely (CDC PLACES) | 38% | 33% | 33% |
| Food insecurity (CDC PLACES) | 24% | 13% | 14% |
| What stands out | Richton Park | IL |
|---|---|---|
| Fewer adults who have had cancer | 5.1% | 7.6% |
| Fewer uninsured adults | 7.9% | 9.9% |
| More adults facing a utility shut-off | 13.3% | 7.8% |
CDC PLACES 2025 · modeled estimates for adults · CMS · HRSA
No broad age group is more than 4 points off the Illinois average. Richton Park’s median age is 44.6 years. Richton Park has lost 2.4% of its people since 2020, down to 12,483 in the Census Bureau’s 2025 estimate.
| Richton Park | Illinois towns | U.S. towns | |
|---|---|---|---|
| Median age | 44.6 years | 40.7 years | 40.5 years |
| Under 18 | 20% | 22% | 22% |
| Aged 65 or older | 20% | 19% | 18% |
56% women, 44% men
About 78 men for every 100 women (the survey’s margin: ±3.3 points). Across Illinois, 50.6% of residents are women.
| Richton Park | IL | U.S. | |
|---|---|---|---|
| Under 10 | 9.6% | 11.5% | 11.6% |
| 10 to 17 | 10.3% | 10.4% | 10.3% |
| 18 to 24 | 6.9% | 9.1% | 9.1% |
| 25 to 34 | 13.3% | 13.6% | 13.7% |
| 35 to 44 | 10.2% | 13.3% | 13.2% |
| 45 to 54 | 14.8% | 12.4% | 12.2% |
| 55 to 64 | 14.8% | 12.8% | 12.7% |
| 65 to 74 | 12.9% | 10% | 10.2% |
| 75 and older | 7.2% | 7% | 7% |
| No diploma | 6.2% | 9.5% | 10.4% |
| High school | 25.4% | 25.1% | 26% |
| Some college | 27.6% | 19.2% | 19.1% |
| Associate’s | 11.5% | 8.3% | 8.8% |
| Bachelor’s | 16.3% | 22.6% | 21.6% |
| Graduate | 12.9% | 15.3% | 14.1% |
Census population estimates, 2025 · U.S. Census Bureau · ACS 2020-2024 5-year estimates
Expected storm and flood damage is higher than in 52% of U.S. communities. Since 1981, 9 flood insurance claims have been paid out in Richton Park.
FEMA flood insurance claims · FEMA National Risk Index · OpenFEMA
5 within 15 miles of the center of Richton Park
About 9 of every 100 Richton Park residents are enrolled in college, against 6 across Illinois.
Village in Illinois, United States
Richton Park is a village in Cook County, Illinois, United States. The population was 12,775 at the 2020 census. It is a south suburb of Chicago.
From Wikipedia, licensed CC BY-SA 4.0 · facts via Wikidata (CC0)
5 towns share a border with Richton Park.
Frankfort next door grades higher for schools (A+ to Richton Park’s C−) and lower for cost of living (D to C).
| Town | IL rank | Overall | Cost | Safety | Schools | Health |
|---|---|---|---|---|---|---|
| Richton Park | #674 | C− | C | C | C− | B |
| Matteson | #620 | C | C− | — | C− | B |
| Park Forest | #675 | C− | C+ | C+ | C− | C |
| Frankfort | #65 | A | D | A− | A+ | A |
| University Park | #705 | D | C | C | C | C |
| Monee Township | #636 | C− | C− | — | C+ | C+ |
Matteson and Monee Township report no FBI crime data of their own. Compare Richton Park with a neighbor →
Short answers, built from the data on this page.
Richton Park grades C− overall, better than 16% of U.S. towns and #674 of 767 in Illinois. It grades B for health, C for safety and C− for schools. Schools is its weak spot, with a C−.
Cost of living, which also weighs rents, property taxes and how many households pay 30% or more of their income for housing, grades C.


